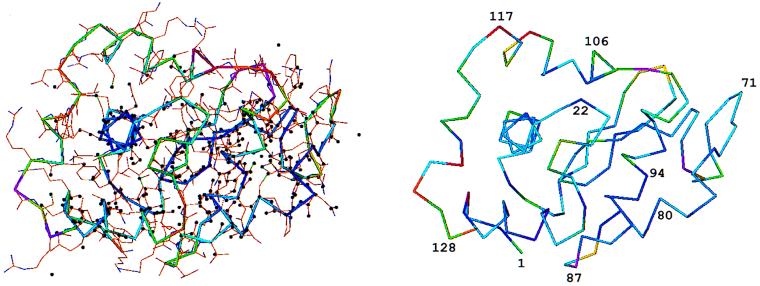
Figure 3.
(Left) Peaks obtained from SnB (black) superimposed onto the triclinic lysozyme model from the PDB. The Cα trace is color-coded according to the temperature factor of the main chain of the model, from 3.5 (blue) to 15.0 (red). (Right) Cα traces for the triclinic lysozyme model color-coded according to the real space fit using program O (0.9 blue, 0.15 red) for main chain atoms with the electron density (E-maps) from SnB. Some residue numbers are marked.

