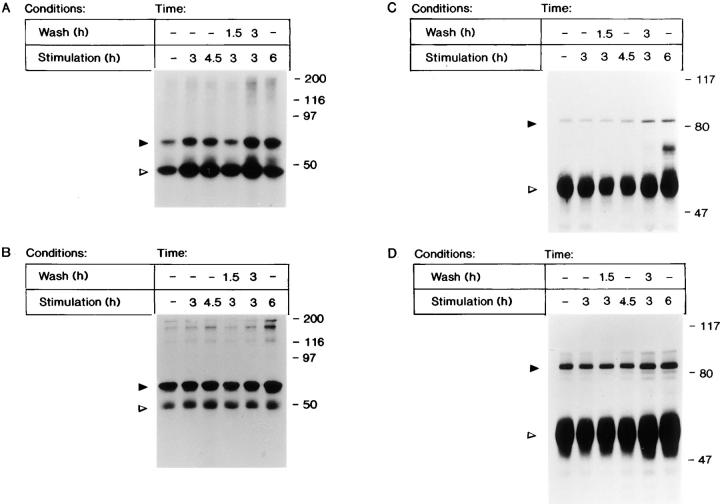
Figure 5.
(A) In vitro Src kinase activity after the removal of FGF-1. Quiescent Swiss 3T3 cells were either stimulated with FGF-1 for 0, 3, 4.5, or 6 h; or were stimulated with FGF-1 for 3 h, washed with heparin, and harvested 1.5 or 3 h after the heparin wash. Cell lysates were immunoprecipitated with anti-c-Src monoclonal antibody 327, and an in vitro kinase assay was performed using enolase as the substrate. The kinase reactions were analyzed by 9% (wt/vol) SDS-PAGE, transferred to nitrocellulose membranes, and phosphorylated Src and enolase were visualized by autoradiography. The position of Src is indicated by a closed arrow, and the position of enolase is indicated by an open arrow. (B) The level of Src protein was visualized by immunoblot analysis with Src2 polyclonal antibodies. The position of Src is indicated by a closed arrow, and the position of IgG is indicated by an open arrow. (C) Tyrosine phosphorylation of cortactin (p80) in response to transient exposure to FGF-1. Quiescent Balb/c 3T3 cells were stimulated, washed, and restimulated with FGF-1 in a manner identical to that described in Fig. 5 A. Cell lysates were immunoprecipitated with rabbit anticortactin antibody 2719 and subjected to immunoblot analysis (7.5% [wt/vol] SDS-PAGE) with an antiphosphotyrosine antibody as described in Materials and Methods. The position of p80 is indicated by a closed arrow, and the position of IgG is indicated with an open arrow. (D) The level of cortactin protein was visualized by immunoblot analysis with anticortactin polyclonal antibodies (72). The position of cortactin is indicated by a closed arrow, and the position of IgG is indicated by an open arrow.

