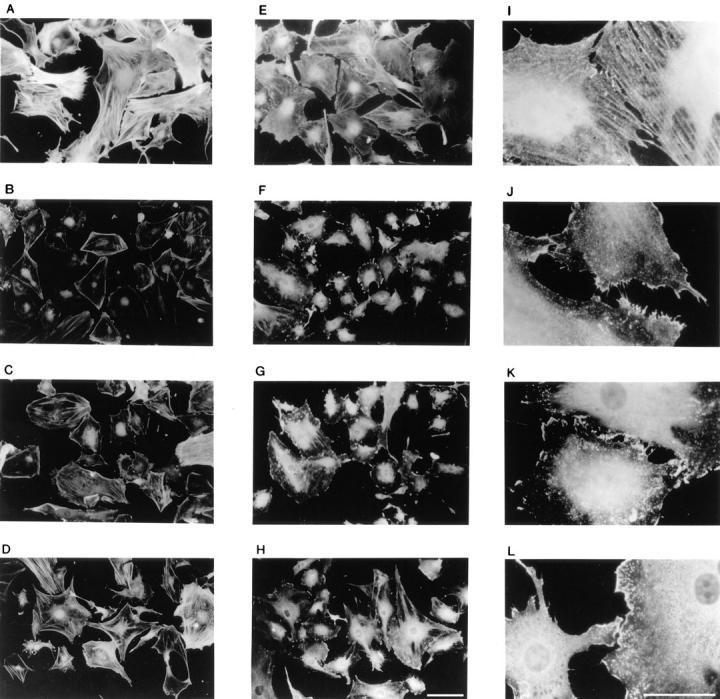
Figure 6.

Fluorescence microscopy of actin and cortactin distribution upon differential FGF-1 stimulation. Quiescent and FGF-1–stimulated Swiss 3T3 cell monolayers were processed for fluorescence microscopy as described in Materials and Methods. Quiescent cells (A, E, and I), cells stimulated with FGF-1 for 3 h (B, F, and J), and cells stimulated with FGF-1 for 3 h followed by a 3-h withdrawal period (C, G, and K), and cells stimulated with FGF-1 for 6 h (D, H, and L) were stained with TRITC-phalloidin (A–D) or with anticortactin antibodies (E–L) and photographed with a fluorescence microscope. Bars: (A–H) 20 μm; (I–L) 15 μm.
