
Figure 7.
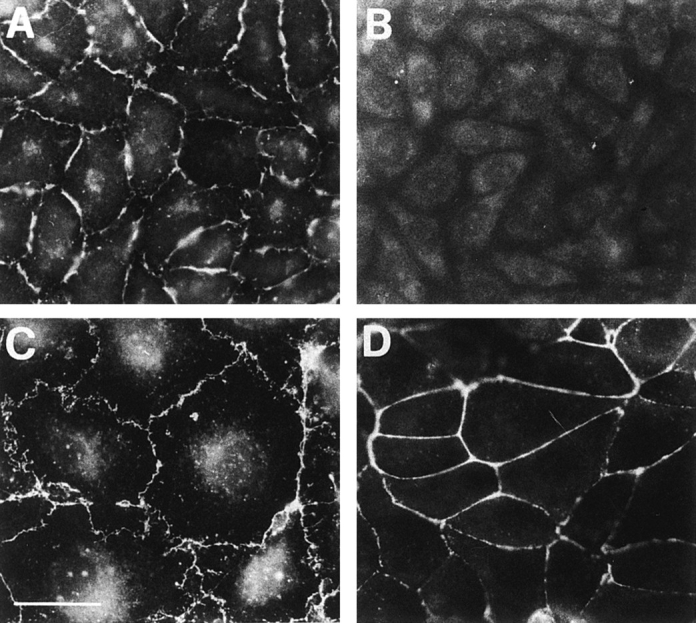
Immunofluorescence analysis of BV12 mAb distribution in CHO cells transfected with JAM (A), control CHO cells (B), H5V endothelial cells (C), and PDV epithelial cells (D). Similarly to BV11 (see Figs. 1, 2, and 6), BV12 staining pattern is restricted to the areas of cell–cell contacts in all the cells expressing JAM. Bar, 5 μm.