
Figure 11.
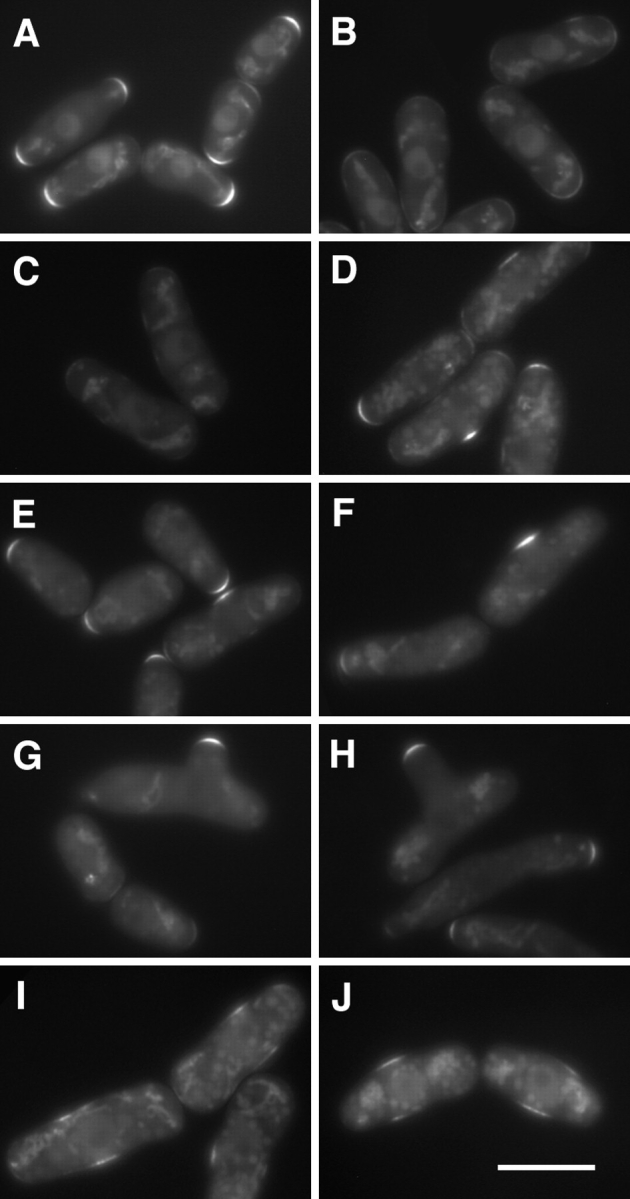
Redistribution of ral3–GFP to the cell middle upon addition of TBZ. (A–H) Localization of ral3–GFP in live cdc10-129 cells in a branching experiment, following the regime shown in Fig. 1. Cells are shown before TBZ addition (A) and 23 (B), 36 (C), 86 (D), 105 (E), 107 (F), 153 (G), and 216 (H) min after TBZ addition. Cells were shifted down to 25°C 30 min after TBZ addition. (I and J) Localization of ral3–GFP in a parallel experiment in which 100 μM LatA was added to cultures 15 min after TBZ addition. Note that at 63 (I) and 85 (J) min after TBZ addition, ral3–GFP is found in the cell middle, although it is more weak and diffuse. Some cells appear wider than normal in part because of flattening. Bar, 10 μm.