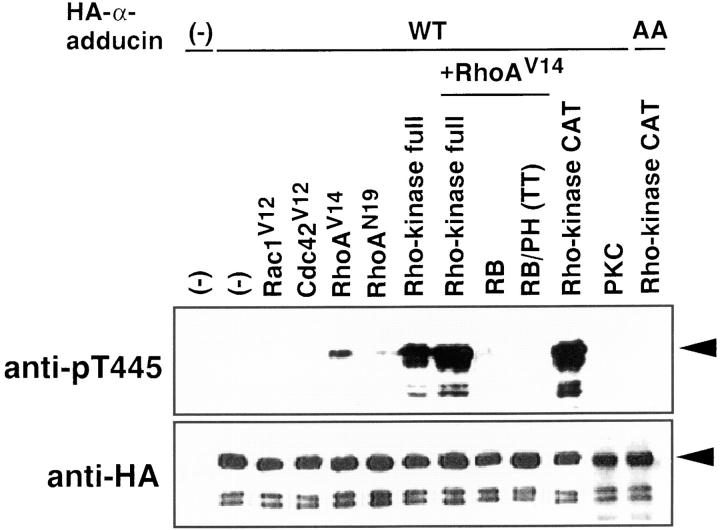
Figure 3.
The phosphorylation of α-adducin via the Rho/Rho-kinase pathway in vivo. pEF-BOS-HA-α-adducin (WT) (3 μg) was cotransfected into COS7 cells with pEF-BOS vector (6 μg), pEF-BOS encoding HA-Rac1V12 (3 μg), HA-Cdc42V12 (3 μg), HA-RhoAV14 (3 μg), HA-RhoAN19 (3 μg), myc-Rho-kinase (full-length) (3 μg), HA-RhoAV14 (3 μg) and myc-Rho-kinase (full-length) (3 μg), HA-RhoAV14 (3 μg) and myc-RB (6 μg), HA-RhoAV14 (3 μg) and myc-RB/PH (TT) (6 μg), and myc-CAT (3 μg) or pcDSRα-PKC (6 μg). pEF-BOS-HA-α-adducin-AA (3 μg) was also cotransfected with myc-CAT (3 μg). As a negative control, pEF-BOS vector (12 μg) alone was transfected. After a 24-h incubation, the transfected cells were incubated in serum-free medium for 24 h. The lysates of the cells were subjected to immunoblot analysis with indicated antibodies. The amounts of the sample in lanes of HA-α-adducin or HA-α-adducin-AA cotransfected with CAT of the upper panel were 30% of the others. Arrowheads indicate the positions of the intact band of HA-α-adducin. The anti-pT445–immunoreactive bands just below the intact HA-α-adducin correspond to endogenous α-adducin. The additional bands which anti-pT445 recognized were the degradation products, because these proteins were also detected by anti-HA antibody. The ratios of phosphorylation at Thr445 to expressed HA-α-adducin were quantitated, and the proportions relative to the ratio of CAT-induced phosphorylation of HA-α-adducin were indicated in brackets as follows: HA-α-adducin alone, or with Rac1V12 or Cdc42V12 (0%); with RhoAV14 (4%); with RhoAN19 (0.3%); with Rho-kinase (20%); with RhoAV14 and Rho-kinase (32%); with RhoAV14 and RB (0.1%); with RhoAV14 and RB/PH (TT) (0%); with CAT (100%); with PKC (0%); and HA-α-adducin-AA with CAT (0%). The results are representative of three independent experiments.

