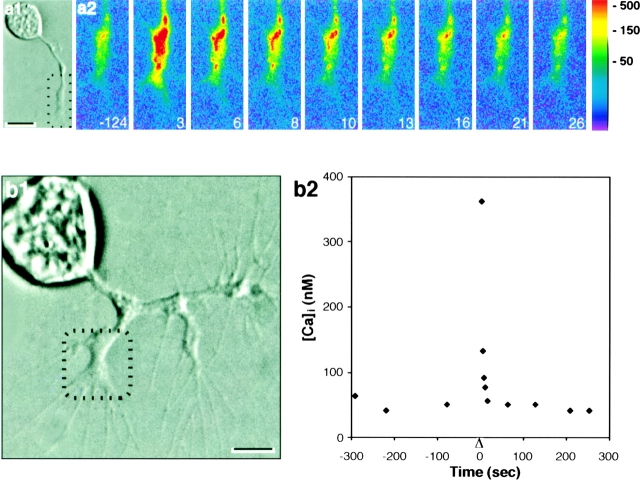
Figure 2.
Elevation of [Ca2+]i after local photolysis. (a1) DIC image of an embryonic CNS neuron in culture. The cell was loaded with NP-EGTA and CG-1. (a2) Pseudocolor images (scale on right in nanomolars) showing [Ca2+]i elevation after a 100-ms photolysis of the growth cone and adjacent nascent axon (a1, box). Time is in seconds. Resting [Ca2+]i, first image. The photolysis flash was given at time 0. (b1) DIC image of a cultured CNS neuron loaded with NP-EGTA and CG-1. (b2) Before and after a 200-ms photolysis at time 0 (triangle), CG-1 fluorescence intensity was measured within selected small regions in the central domain of one growth cone (b1, box). [Ca2+]i was calculated using the CG-1 calibration curve (Fig. 1 a). Bars, 10 μm in a1, 5 μm in b1.

