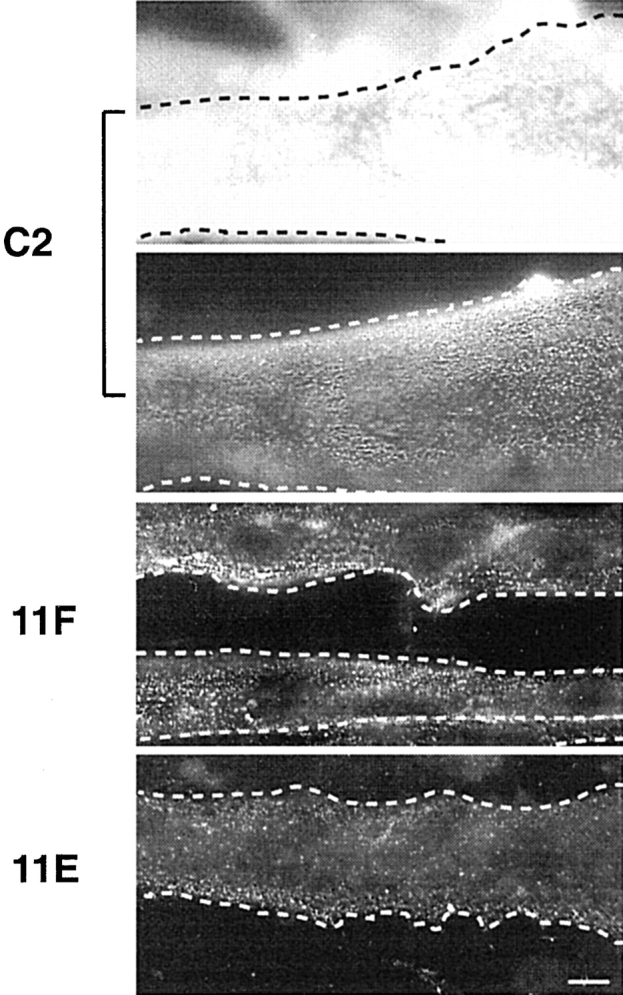
Figure 3.

α-DG expression on the surface of C2, 11F, and 11E myotubes. Cultures of C2, 11F, and 11E myotubes were immunostained with mAb IIH6 to α-DG. For the same exposure time, α-DG staining in C2 myotubes (C2, top) was extremely intense compared with 11F and especially 11E cells. Since the specific signal was amplified using the biotin-streptavidin system (see Materials and Methods), differences in fluorescence intensity are qualitative, not quantitative. A shorter exposure time for C2 cells (C2, bottom) revealed a fine punctate immunoreactive pattern on the myotube surface. In 11F and 11E cells the density but not the pattern of expression of α-DG was affected. The dotted lines show the myotube outline. Bar, 10 μm.
