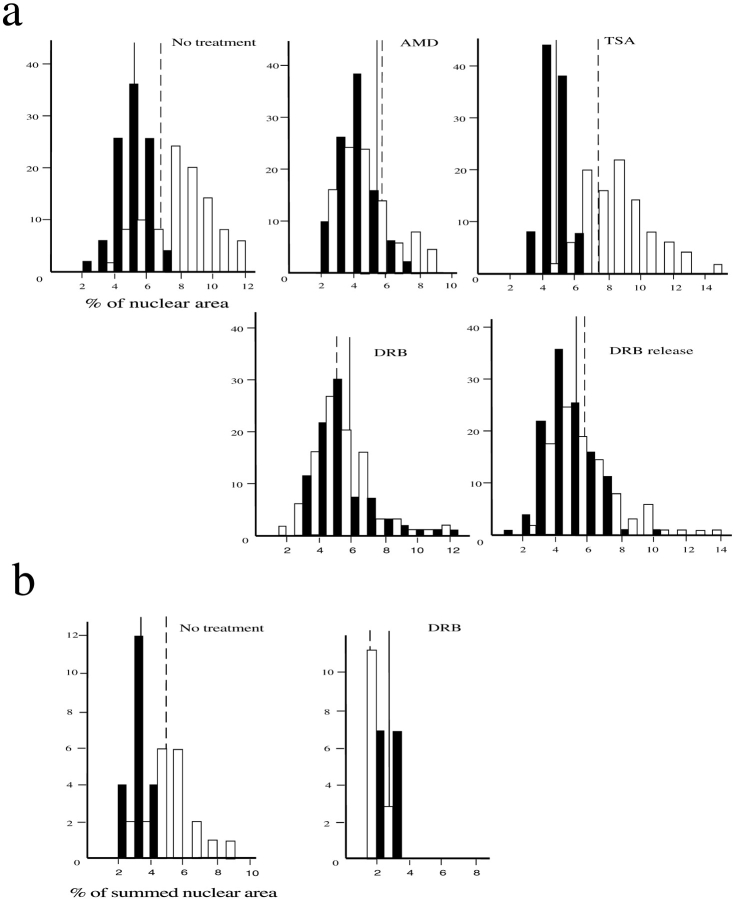
Figure 4.
Dependence of territory sizes on transcription and histone deacetylation. (a) Frequency histograms of the proportion of nuclear area occupied by hybridization signals (detected with FITC) of HSA18 (filled bars) and 19 (open bars) in 50 swollen and flattened MAA-fixed lymphoblastoid nuclei. (b) Histograms of the proportion of summed nuclear area occupied by hybridization signals (detected with FITC) of HSA18 (filled bars) and 19 (open bars) through the confocal sections of 5–10 fibroblast nuclei fixed with 4% pFa. Vertical solid and dashed lines show mean proportionate areas for HSA18 and 19, respectively. Cells were either untreated, or treated with AMD, DRB, or TSA before harvest. DRB-treated cells were also grown for 1 h in the absence of DRB (DRB release).

