
Figure 1.
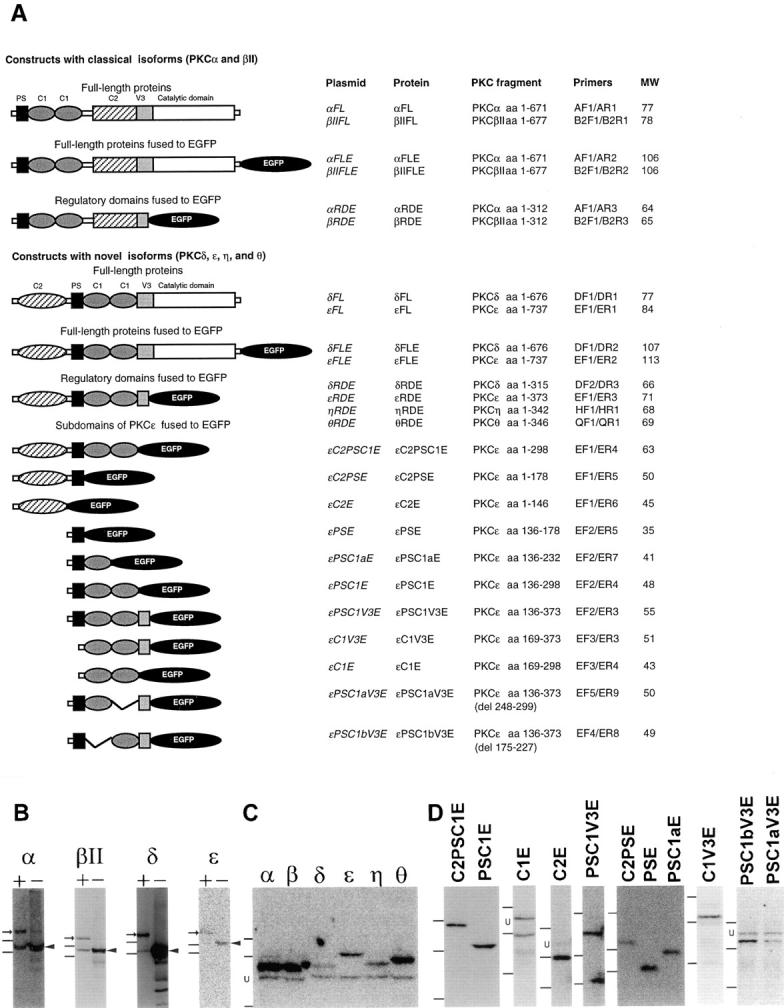
PKC–EGFP fusion constructs used in this study. (A) List of PKC constructs produced for this study. The left column shows schematic composition of PKCε fragments coded for by the expression vectors used in this study: PS (pseudosubstrate), C1, C2, and V3 domains. The primers used for amplification of the cDNA fragments are listed in Table I. The predicted molecular weights of the fusion proteins are included. (B–D) COS cells were transfected with the plasmids listed in A and the formation of the protein products were analyzed with Western blot technique. (B) Analysis of full-length PKC isoforms α, βII, δ, and ε fused to EGFP (+) or expressed without any tags (−). Immunoblots were performed with isoform-specific antibodies. Arrows indicate reactivity corresponding to PKC– EGFP fusion proteins and arrowheads point to the untagged PKC isoforms. The presence of full-length PKCα, βII, and δ immunoreactivity in cell lysates from cells overexpressing EGFP fusions indicates endogenous levels of respective isoform in COS cells. The positions of two weight markers, 97 and 66 kD, are included to the left of the blots. (C) Analysis of RDs from PKCα, βI/II, δ, ε, η, and θ fused to EGFP. Cell lysates from COS cells transfected with respective expression vectors were analyzed with immunoblot using an anti-GFP antibody as primary antibody. The positions of three weight markers, 97, 66, and 46 kD, are included to the left of the blot. (D) Analysis of PKCε subdomains fused to EGFP. Cell lysates from COS cells transfected with respective expression vectors were analyzed with immunoblot using an anti-GFP antibody as primary antibody. The positions of three weight markers, 66, 46, and 30 kD, are included to the left of the blots. U denotes an unspecific band at ∼55 kD, which appeared in some immunoblots in C and D, when using the GFP antibody on COS cell lysates.