Figure 2.

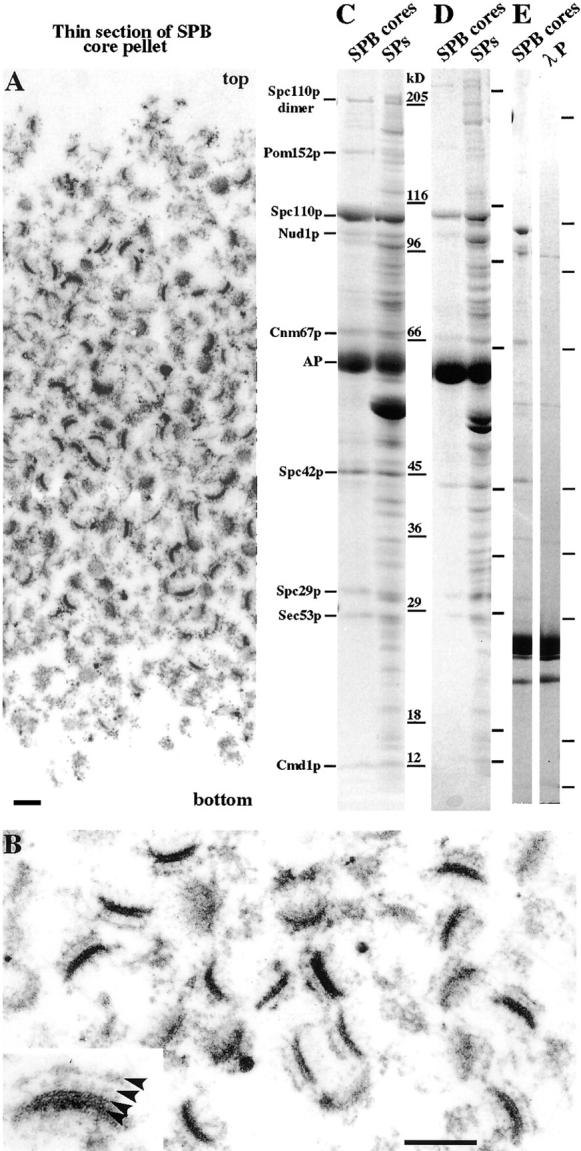
Analysis of heparin-extracted SPB cores. (A) Thin section of the entire pellet. B is a higher magnification, and the inset in B shows the structural features of the lower right SPB core with arrowheads showing from the top down: the depleted outer plaque, IL1, IL2, and the central plaque. In SPBs from whole cells the IL2 and central plaque layers appear fused and together are called the central plaque. (C and D) Coomassie-stained SDS gradient gels of alkaline phosphatase (AP) or (E) λ phosphatase (λP)-digested SPB cores together with λ phosphatase alone. Identifications of the main bands by MALDI mass spectrometry are to the left of C. The SPB cores in C were isolated from ∼1011 cells. Lines beside the gel lanes in D and E show the positions of the same molecular weight standards used in C. Bars, 0.2 μm.
