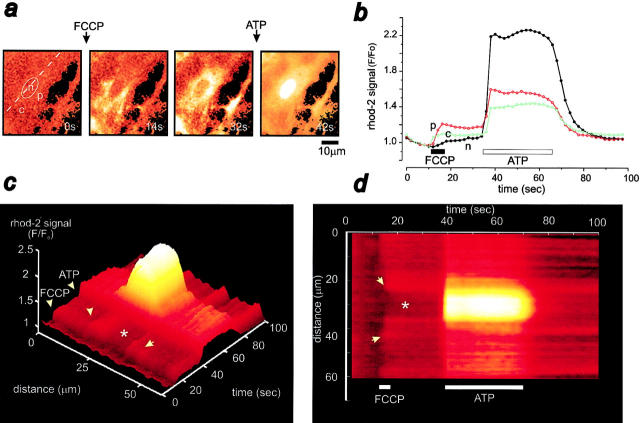
Figure 4.
Mitochondrial depolarization prevents mitochondrial Ca2+ uptake. (a) Time series of ratioed images showing the changes in [Ca2+]n and in [Ca2+]cyt occurring in a rhod-2–loaded cortical astrocyte after application of 1 μM FCCP (with 2.5 μg/ml oligomycin) followed by ATP challenge (100 μM). p, c, and n signal a perinuclear, a cytosolic, and the nuclear regions, respectively. Note the absence of any mitochondrial, particulate rhod-2 signal during ATP application. (b) Corresponding time courses of [Ca2+]n (n, closed circle) and [Ca2+]cyt (c and p, open circle) upon application of FCCP/oligomycin and ATP. The rhod-2 fluorescence intensity before addition of ATP was normalized to one against the first image. The surface plot shown in c and the equivalent line image shown in d illustrate the evolution of the nuclear and cytosolic Ca2+responses to FCCP/oligomycin and to ATP with time. The asterisk and the ellipse indicate the position of the nucleus. Note the initial increase in the perinuclear and the cytosolic regions (arrows) upon FCCP application, followed later by a rise in [Ca2+]n. However, ATP elicited a global rise in [Ca2+]cyt and [Ca2+]n. The traces shown in b illustrate the response of a representative cell.

