
Figure 3.
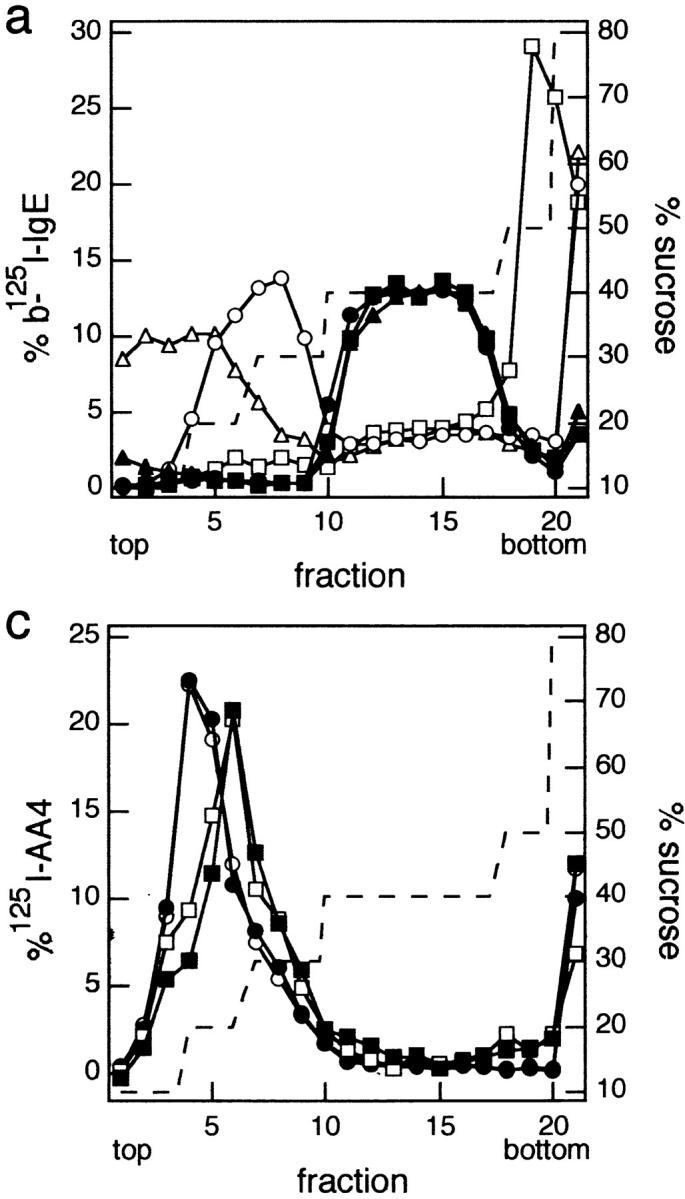

Molecular distributions of IgE–FcεRI, Lyn, and GD1b on sucrose density gradients. (a) IgE–FcεRI distributions. Shown are representative sucrose gradient results in which cells were sensitized with biotinylated 125I-IgE (b-125I-IgE) and either cross-linked with 10 nM streptavidin (sAv, open symbols) for 5 min at 37°C or not cross-linked (closed symbols). Cells were then lysed with cold TX-100 lysis buffer containing 0.040% TX-100, loaded onto sucrose step gradients, and analyzed. Before cross-linking with sAv (or not), cells were incubated: (1) without MβCD for 1 h at 37°C, then subsequently for 2 h at 37°C in the absence of MβCD or cholesterol– MβCD (untreated; circles); (2) with 10 mM MβCD for 1 h at 37°C, followed by a subsequent treatment with 3 mM MβCD for 2 h at 37°C (depleted; squares); or (3) with 10 mM MβCD for 1 h at 37°C, followed by cholesterol/MβCD (3 mM MβCD; MβCD/ cholesterol, 8:1, mol/mol) for 2 h at 37°C (repleted; triangles). (b) Lyn distributions. Equal amounts of sucrose gradient fractions pooled as indicated were loaded onto nonreducing SDS polyacrylamide gels and immunoblotted for Lyn. Top, untreated cells; middle, cholesterol-depleted cells; and bottom, cholesterol-repleted cells as described in a. Note that the fraction denoted bottom includes the pellet. (c) GD1b distributions. RBL cells sensitized with biotinylated IgE were labeled with 125I-AA4 (anti-GD1b), cross-linked or not with sAv, lysed, and subjected to sucrose density gradient analysis as in a. Distributions of GD1b from cells stimulated with sAv as in a are denoted by open symbols and those from unstimulated cells are denoted by closed symbols. Circles indicate untreated cells, and squares indicate cells that had been treated with 10 mM MβCD for 1 h.