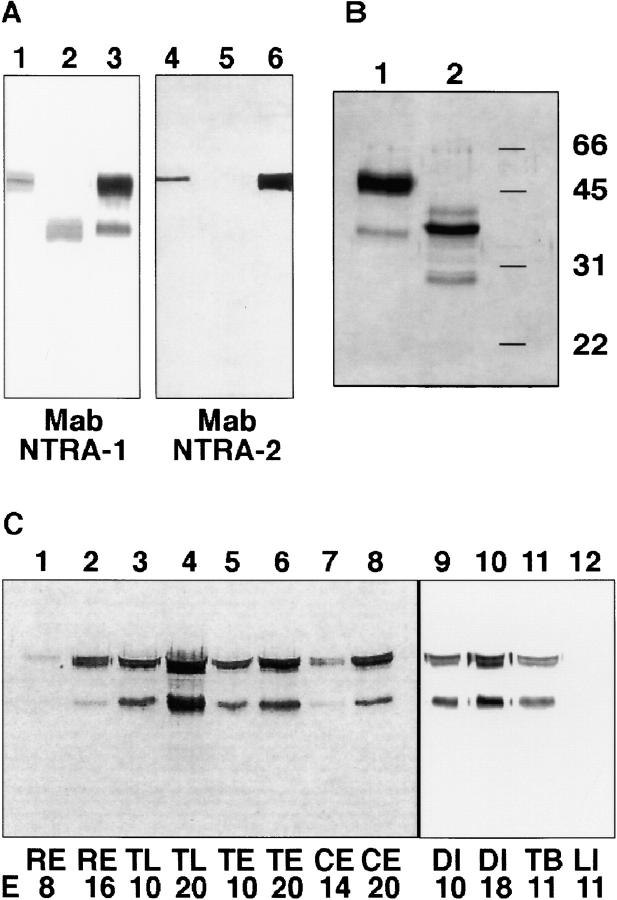
Figure 2.
Neurotractin occurs in two isoforms and is upregulated in development. (A) Lysates of COS cells that had been transfected with the L-form (lanes 1 and 4) or S-form (lanes 2 and 5) of neurotractin were compared with mAb NTRA-1 immunoaffinity isolate (lanes 3 and 6) by SDS-PAGE. In Western blots mAb NTRA-1 stains both isoforms as well as both bands in the immunoaffinity isolate (lanes 1–3) whereas mAb NTRA-2 detects only the L-form and the larger band of the immunoaffinity isolate (lanes 4–6). (B) Neurotractin that was isolated by immunoaffinity chromatography from adult chicken brains using mAb NTRA-1 was subjected to SDS-PAGE and detected by silver staining. Neurotractin resolves in two bands, one of 50 kD and one of 37 kD (lane 1). Deglycosylation by endoglycosidase F/peptide-N-glycosidase F leads to a reduction of the molecular mass to 38 and 30 kD, respectively (lane 2). The 40-kD component (lane 2) represents a deglycosylation intermediate. (C) Samples of different regions of embryonic chick brain from early and late developmental stages were solubilized in SDS-PAGE sample buffer, resolved by SDS-PAGE, and probed with mAb NTRA-1 directed to neurotractin (each lane represents 30 μl of 1% brain homogenate). Comparison of samples from early stages with those from late stages shows that in each analyzed brain region neurotractin expression increases during development (lanes 1–10). Neurotractin can be detected in total brain but not in liver (lanes 11 and 12). E, embryonic day; RE, retina; TL, telencephalon; TE, tectum; CE, cerebellum; DI, diencephalon; TB, total brain; LI, liver.

