Figure 3.
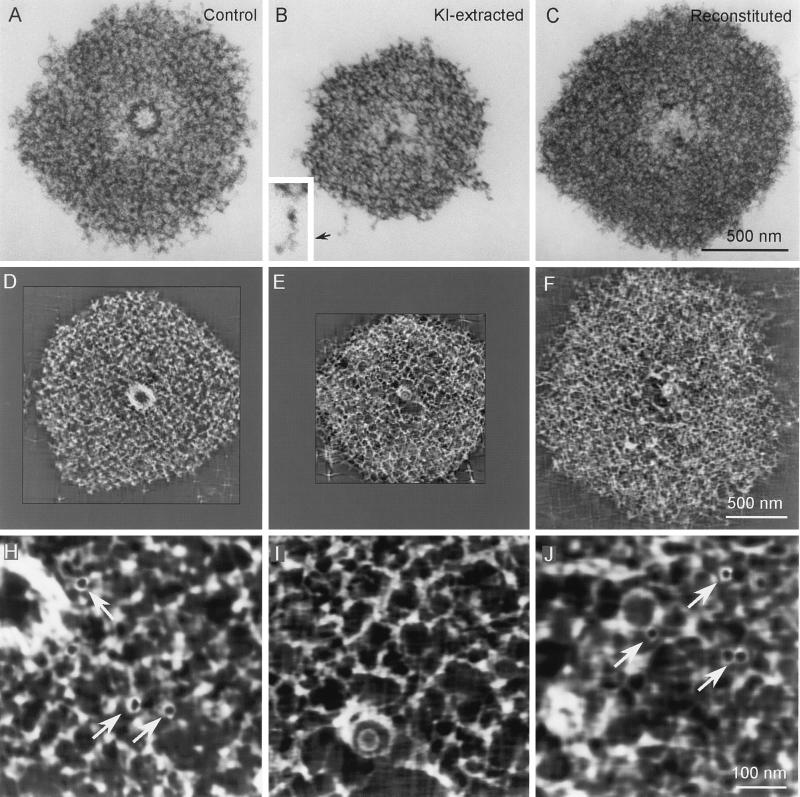
IVEM analyses of control (A, D, and H), KI-extracted (B, E, and I), and reconstituted (C, F, and J) Spisula centrosomes. A–C are electron micrographs of 0.25-μm-thick sections cut through the centriole-containing region of the centrosome. D–F represent single 3-nm-thick slices through the tomographic volume computed from centrosomes similar to those in A–C. H–J are higher magnification images of the centrosome matrix pictured in D–F. Note that the 25-nm-diameter ring-shaped structures seen in control (arrows in H) and reconstituted (arrows in J) centrosomes are absent from the KI-extracted centrosome (I). Note also that the matrix of the KI-extracted centrosome is comprised of an interconnected latticework of 12- to 15-nm-diameter filaments (see D, E, H, and I) that can be resolved in the raw IVEM images at the peripheral edges of the matrix (B Inset).

