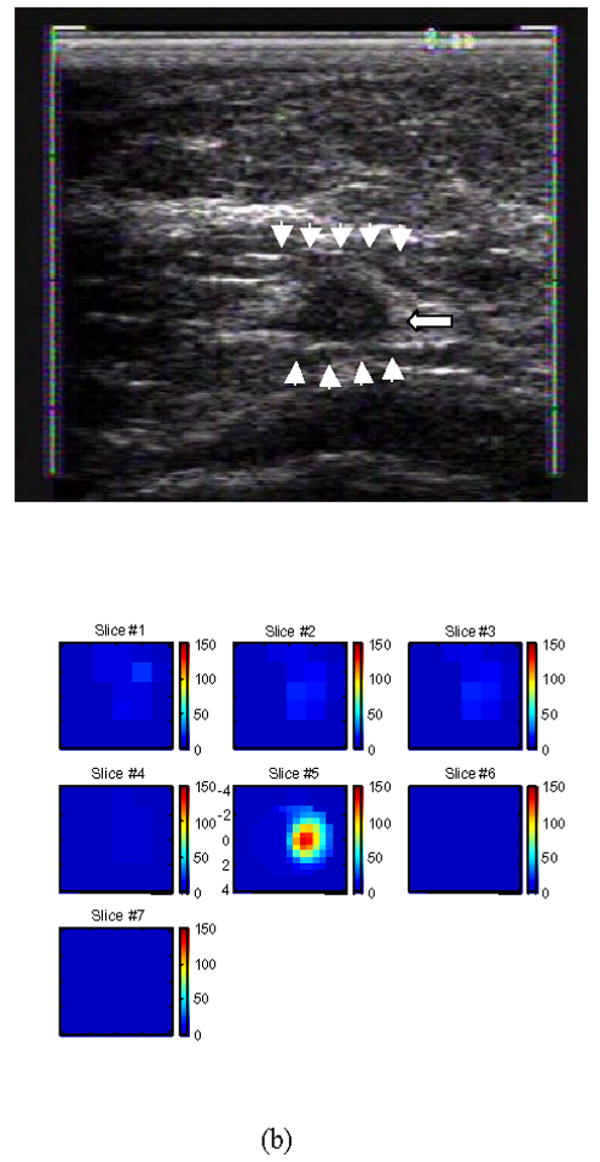
Fig.5.

(a) shows a gray scale ultrasound image of a non-palpable lesion of a 55-year-old woman. The lesion measuring 8 mm in diameter pointed by the arrow was located at the 4 o’clock position of the right breast. Ultrasound showed a nodular mass with internal echoes and the lesion was considered suspicious. (b) is the total hemoglobin concentration distribution computed from the optical absorption maps obtained at 780nm and 830 nm wavelengths (no shown). For each slice n (b), x and y axes are spatial probe dimensions of 9 cm by 9 cm. The slices beginning from left to right correspond to hemoglobin maps from 0.7 cm underneath skin surface to chest wall in 0.5 cm spacing. [Published with permission of Neoplasia; Ref. 30].
