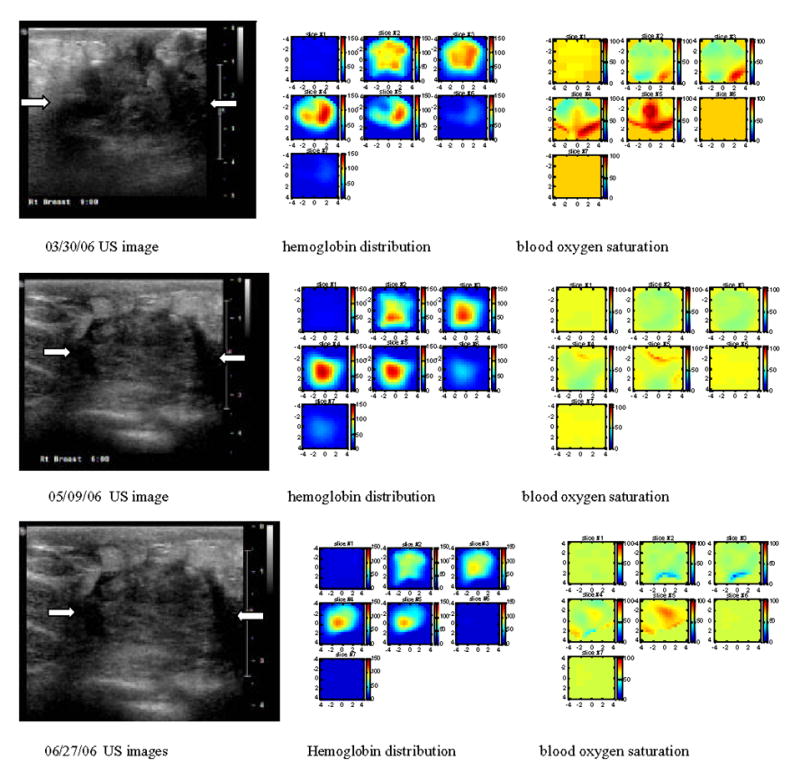
Fig.7.


Corresponding US images acquired at the beginning (a), after 2 cycles (b) and 4 cycles (c) of chemotherapy, and before surgery (d). The white arrows mark the approximate left and right margins of the tumor. (a1), (b1), (c1) and (d1) are corresponding NIR hemoglobin concentrations, while (a2), (b2), (c2) and (d2) are corresponding blood oxygen saturation maps. For each hemoglobin and oxygen saturation map of (a1)–(d1) and (a2)–(d2), each small slice in the map is the x–y image of 9 cm by 9 cm. The first slice is obtained at 0.5-cm depth from the skin surface and the last slice #7 is 3.5 cm deep toward the chest wall. The slices in each hemoglobin and oxygen saturation map are numbered from left to right and top to bottom. Hemoglobin maps showed rim-enhancement initially and reduced in spatial dimension and also quantitative level at the end of the treatment.
