Figure 6.
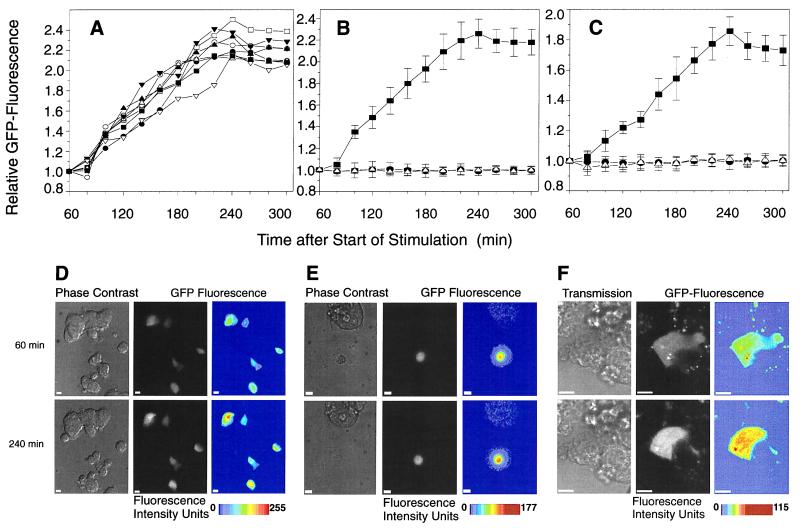
On-line monitoring of insulin promoter-driven GFP expression in HIT-T15 cells and pancreatic islet cells. (A) On-line monitoring of eight individual HIT cells transfected with prIns1GFP and stimulated with 16.7 mM glucose for 15 min. (B) On-line monitoring of HIT cells transfected with prIns1GFP (■ and ▵) or pRcCMVGFP (•). Cells transfected with prIns1GFP (■, n = 8, summarized data from Fig. 2A) and with pRcCMVGFP (•, n = 10) were stimulated with 16.7 mM glucose. Nonstimulated cells transfected with prIns1GFP (n = 10) are shown as ▵. All data are shown as mean values ± SD. (C) On-line monitoring of pancreatic islet cells transfected with prIns1GFP (■ and ▵) or pRcCMVGFP (•). Cells transfected with prIns1GFP (■, n = 7) and with pRcCMVGFP (•, n = 10) were stimulated with 16.7 mM glucose. Nonstimulated cells transfected with prIns1GFP (n = 7) are shown as ▵. All data are shown as mean values ± SD. (D–F) Representative images (out of a total of 50) of cells are shown 60 and 240 min after the start of glucose stimulation. Images were obtained either by digital imaging fluorescence microscopy from transfected HIT (D) and primary islet cells (E) or from transfected HIT cells by laser-scanning confocal microscopy (F). Fluorescence images are shown as “gray scale” and “pseudo-color.” The “pseudo-color” images were created by converting the original “gray scale” data using tina 2.07d software (Raytest); the fluorescence signal increased from blue to red. The monitored cell cluster also is shown as a transmission/phase-contrast image (confocal microscopy/digital imaging, respectively). The scale bars represent 10 μm.

