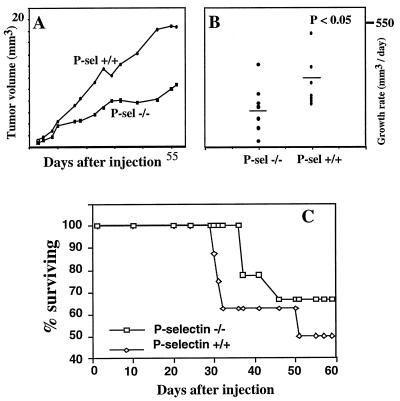
Figure 2.
Effects of P-selectin deficiency on primary tumor growth rate and survival. (A) The length and width of tumors arising from s.c. injected LS180 cells were measured and their volumes were calculated. Average tumor size for each mouse group (n = 9 per group) is plotted against time. (B) The growth rate at day 30 for each mouse was measured when all were still alive and was analyzed for statistical significance by using the Wilcoxon rank–sum test. The null hypothesis of equal ranks was rejected (P < 0.05). (C) Survival curve of mice with s.c. tumors (n = 9 per group). The trend toward improved survival did not achieve full statistical significance at 60 days, when institutional animal welfare guidelines required termination of the experiment.

