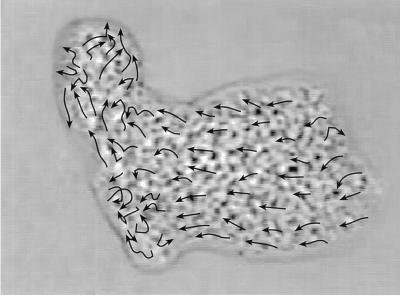
Figure 3.
A computer image of a single video frame of a 2-D slug in the process of splitting in two. The arrows represent 6 min of cell movement, using the same methods described in the caption of Fig. 2. Note the two active regions of cell motion that are moving away from one another. (The cell mass is 139 μm long and is made up of ≈330 amoebae.)

