
Figure 7.
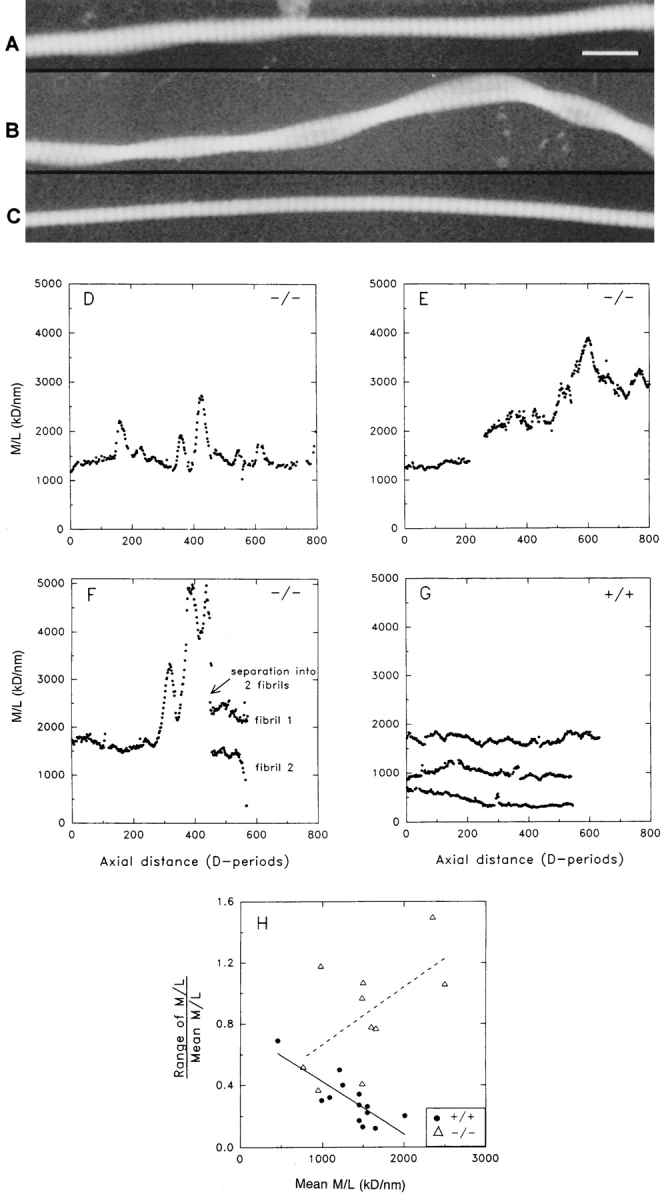
Mass mapping of collagen fibrils isolated from the skin of decorin-deficient animals reveals pronounced nonuniformity in the axial mass distributions with repeated bulges. (A–C) Typical dark-field STEM images of isolate unstained fibrils from mouse skin. A and B show typical images for fibrils from a decorin-deficient mouse. A shows a single fibril with distinct bulging at two locations over 60 D-periods (1 D = 67 nm) length. B is consistent with two fibrils twisted together in close contact but not fused. C shows a typical fibril from control skin with uniform diameter along its length. (D–G) Axial mass distributions of single fibrils obtained by measurements from STEM images. A measurement of mass per unit length was made every two D-periods along the entire available length of each fibril. Missing points occur where parts of a fibril were clearly contaminated. (D–F) Typical axial mass distribution profiles from the decorin-deficient sample or (G) from wild-type animals. The decorin-deficient sample shows pronounced mass peaks in the fibrial axial mass distribution, which are not found in the control. (H) Scatter plot of the relative variation in M/L along single fibrils against the corresponding mean M/L. First order regression lines are shown superimposed on each set of data. The data from the decorin-deficient samples show an overall increase in the relative intrafibrillar variation in M/L with increasing lateral size (Mean M/L); this contrasts with the control sample that shows the opposite trend. Bar, 200 μm.