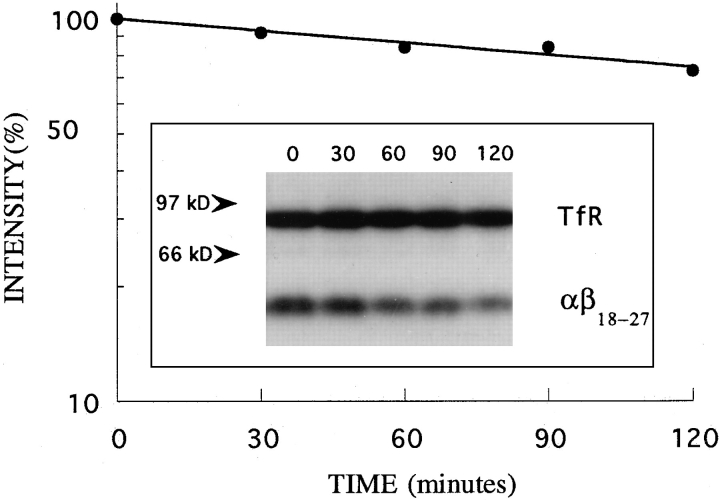
Figure 10.
Turnover of αβ18–27 in K562 cells. The cells were iodinated, washed, and incubated in chase medium. At the indicated times, cells were harvested and lysed. αβ18–27 chimera (mol wt ∼55 kD) and transferrin receptor (mol wt ∼90 kD) were immunoprecipitated from the lysates with 7G7B6 anti-IL2Rα and OKT9 anti-transferrin receptor mAb, and separated by SDSPAGE (inset). Radioactivity in the bands was quantitated by phosphorimager analysis. The ratio of αβ18–27 chimera to transferrin receptor was calculated at each time point. The values in the graph represent the percentage of this ratio at different times relative to that at time zero.

