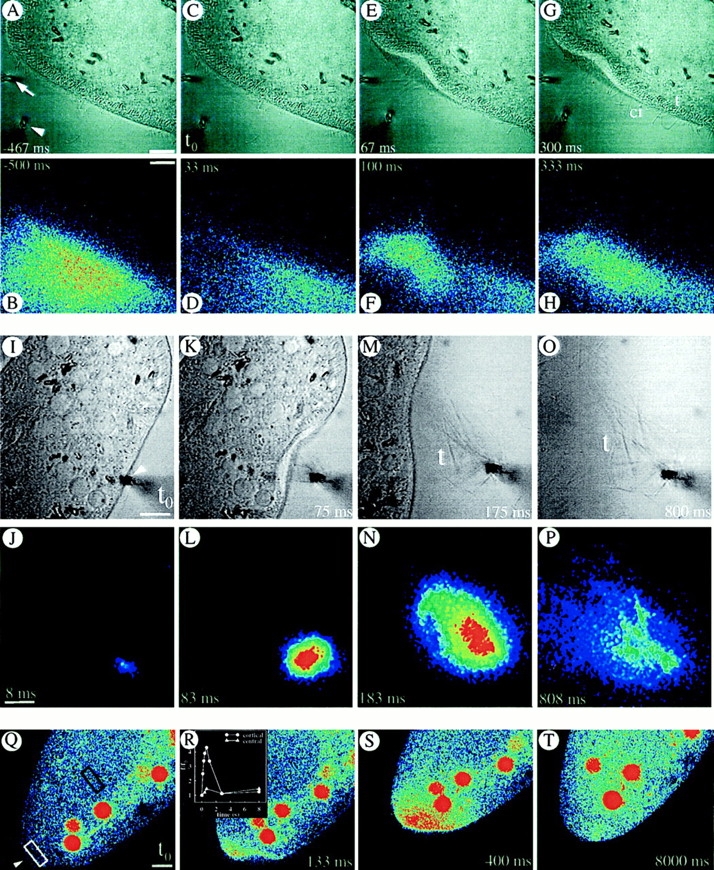
Figure 10.

(A–H) Consecutive local application of fluorescein-tagged EGTA (by a horizontal pipette at arrow) and of AED (by vertical pipette at arrowhead in the phase contrast image, (A) allows determination of actual EGTA concentration at the cell surface (see Methods). Although pressure application of AED slightly deforms the cell at 67 ms, no side effects occur. At the cell membrane, tightly packed ∼5 μm long, rod-like trichocysts (t) are visible inside, whereas some cilia (ci) of similar length can be recognized outside (e.g., at 67 and 300 ms). The effectiveness of EGTA is implied by the absence of any expelled, decondensed trichocyst contents; these would expand to ∼30 μm (M and O) by a process requiring Ca2+ e (see Introduction). (I–P) Cell triggered with fluorescein-tagged AED in presence of 0.1 mM [Ca2+]e. Note expansion of trichocyst contents (t), after exocytosis, in the phase contrast image. (Q–T) Absence of Ca2+ e allows for a local Ca2+ i-excited Fluo-3 signal without further spreading. Local AED application (arrowhead) with 10 mM EGTA in the medium. (Red balls are phagosomes which have sequestered some of the fluorochrome injected.) Note that [Ca2+]i increase remains restricted to the region reached by AED, without subsequent far reaching signal spreading, e.g., from white to black frame (R). Bars, 10 μm.
