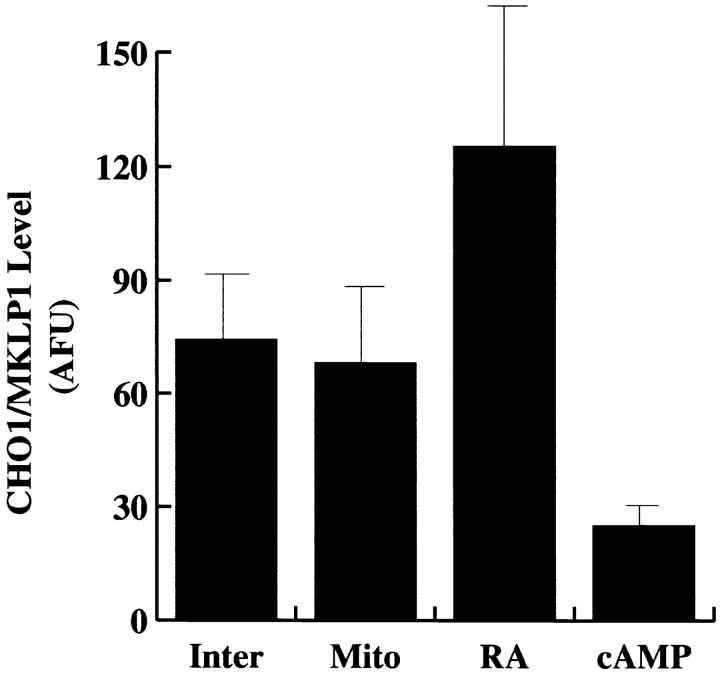
Figure 5.
Quantitative immunofluorescence analyses on the levels of CHO1/MKLP1 within interphase neuroblastoma cells (Inter), cells undergoing mitotis (Mito), cells treated with retinoic acid (RA), and cells treated with cAMP (cAMP). Protein levels were measured in arbitrary fluorescence units (AFU). Ten cells were examined under each condition, and a mean ± SD was obtained for each condition. Statistical analyses using the student's t test indicate no statistical difference between interphase and mitotic cells (P < 0.687), but marked differences between retinoic acid– treated cells and the other experimental conditions (P < 0.001) and between cAMP-treated cells and the other experimental conditions (P < 0.0005). Retinoic acid–treated cells had significantly higher levels of CHO1/MKLP1 while cAMP-treated cultures had significantly lower levels of CHO1/MKLP1.

