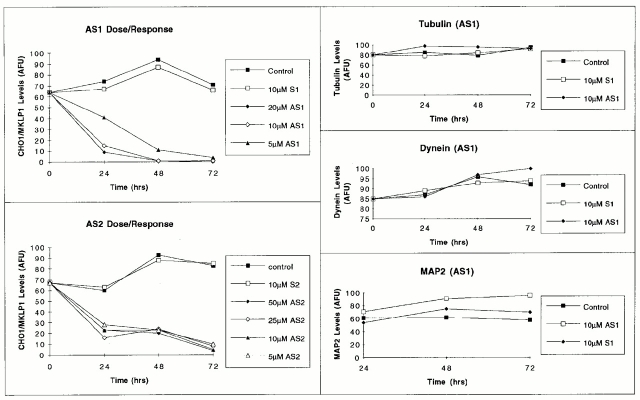
Figure 6.
Quantitative analyses on the levels of CHO1/MKLP1 (left two panels), and the levels of tubulin, dynein, and MAP2 (right three panels) in cultures treated with antisense and sense oligonucleotides. Protein levels were determined using quantitative immunofluorescence microscopy, and were expressed in arbitrary fluorescence units (AFU). Only process-bearing cells were scored in these analyses, and 100 cells were analyzed for each experimental condition and time point. Standard deviations were generally low, on the order of 15 AFU, and could not be included on the graph because the error bars would be short and blur together. Both AS1 and AS2 treatments resulted in diminished staining for CHO1/MKLP1 in a dose- and time-dependent manner. Sense controls did not affect CHO1/ MKLP1 levels. Neither antisense nor sense oligonucleotides resulted in diminutions in the levels of β-tubulin, dynein, or MAP2.

