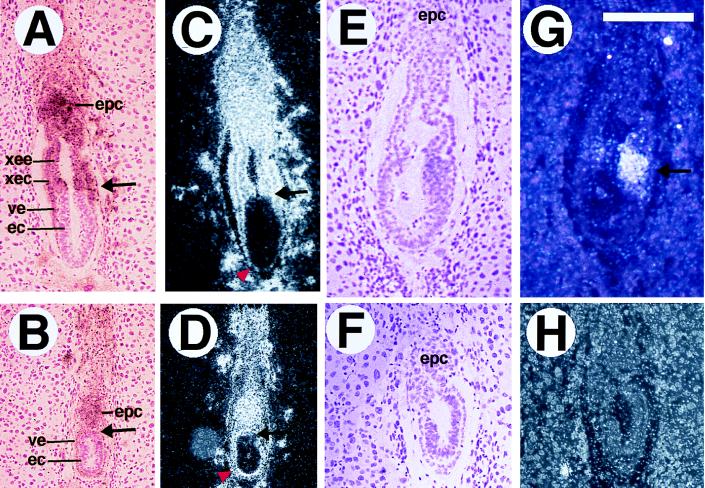
Figure 4.
In situ analysis of smad2ΔC/ΔC embryos at E6.5. A, B, E, and F are bright-field views, and the four others are dark-field views. (A–D) H19 expression in control (A and C) and mutant (B and D) embryos. H19 marks the ectoplacental cone (epc), extraembryonic endoderm (xee) and ectoderm (xec), and visceral endoderm (ve). The H19 expression domain in the E6.5 mutant is smaller than that of the control, and the extraembryonic ectoderm and extraembryonic endoderm appear to be missing. Arrows in A–D point to the boundary between extraembryonic and embryonic portions, and arrowheads in C and D point out the visceral endoderm, which is flattened at the distal tip of the control embryo (C), but remains thickened in the mutant (D). T expression is shown in normal (E and G) and mutant (F and H) embryos. T labels involuting mesodermal cells (arrow in G), which are not in the smad2ΔC/ΔC mutants. (Bar, 258 μm for A–D and 180 μm for E–H.)

