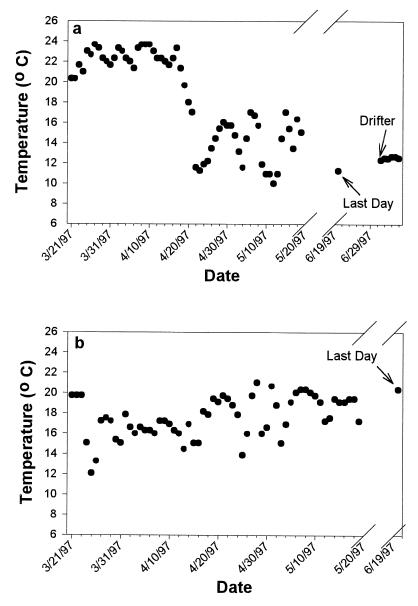
Figure 5.
Daily average water temperatures for two bluefin tuna, denoted in Fig. 4 as A (9752) and B (9851), that went due north and east, respectively. Temperatures are recorded hourly and compiled as one 24-hr average (solid circles). The first 60 points represent the first 60 days, and the 61st data point is the average temperature from the last day before pop-off (day 90). The points after the final day are temperature measurements as the tag drifts on the surface after it releases from the fish. (a) Temperature data for bluefin 9752 (111 kg), which was double-tagged (both archival and pop-off tags deployed) and located on Georges Banks (A in Fig. 4) on June 21, 1997. (b) Thermal history for bluefin 9851, a 200-cm (136 kg) fish that moved the furthest north in the study and was in the Gulf Stream (not shown) when the tag released on June 19, 1997.

