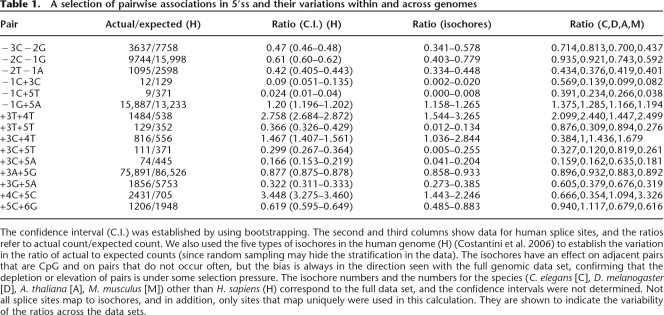
Table 1.
A selection of pairwise associations in 5′ss and their variations within and across genomes
The confidence interval (C.I.) was established by using bootstrapping. The second and third columns show data for human splice sites, and the ratios refer to actual count/expected count. We also used the five types of isochores in the human genome (H) (Costantini et al. 2006) to establish the variation in the ratio of actual to expected counts (since random sampling may hide the stratification in the data). The isochores have an effect on adjacent pairs that are CpG and on pairs that do not occur often, but the bias is always in the direction seen with the full genomic data set, confirming that the depletion or elevation of pairs is under some selection pressure. The isochore numbers and the numbers for the species (C. elegans [C], D. melanogaster [D], A. thaliana [A], M. musculus [M]) other than H. sapiens (H) correspond to the full data set, and the confidence intervals were not determined. Not all splice sites map to isochores, and in addition, only sites that map uniquely were used in this calculation. They are shown to indicate the variability of the ratios across the data sets.

