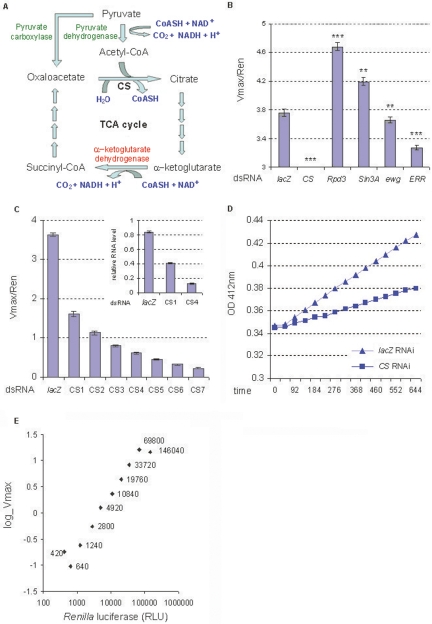
Figure 1.
Development of a CS activity assay for genome-wide RNAi screen in S2 cells. (A) TCA cycle and pyruvate metabolism. The biochemical reactions catalyzed by Citrate synthase, Pyruvate dehydrogenase, and α-ketoglutarate dehydrogenase are shown. (B) The effects of dsRNAs of the known mitochondria regulators on the normalized CS activity (Vmax/Ren) in S2 cells (n = 48). The value of CS is 0.22; 5 μg/mL dsRNA was used. **P < 0.01, ***P < 0.001. Error bars indicate the standard errors. (C) Dose response of the CS activity to Citrate synthase RNAi (n = 48). The normalized CS activities were reduced by RNAi in a dose-dependent manner. Seven dosages of Citrate synthase dsRNA were used, from CS1 to CS7, being 0.5, 1, 2, 4, 8, 16, 32 μg/mL/106 cells. The relative Citrate synthase RNA expression levels after RNAi are shown (upper right). (D) The stability of the CS activity in S2 cells. The CS activity level was represented by the Vmax; 0.5 μg/mL dsRNA was used. Optical densities (OD) at 412 nm for cell lysates from lacZ RNAi and Citrate synthase RNAi are shown on the Y-axis. The X-axis shows time in seconds, and data were captured every 46 sec. (E) The linear range of the CS activity in S2 cells (n = 48). The Y-axis shows CS activity (Vmax). The X-axis shows the Renilla luciferase activity (RLU) of cell lysates. The Renilla luciferase activities are labeled next to each data point. Log scales are applied to both X- and Y-axes.

