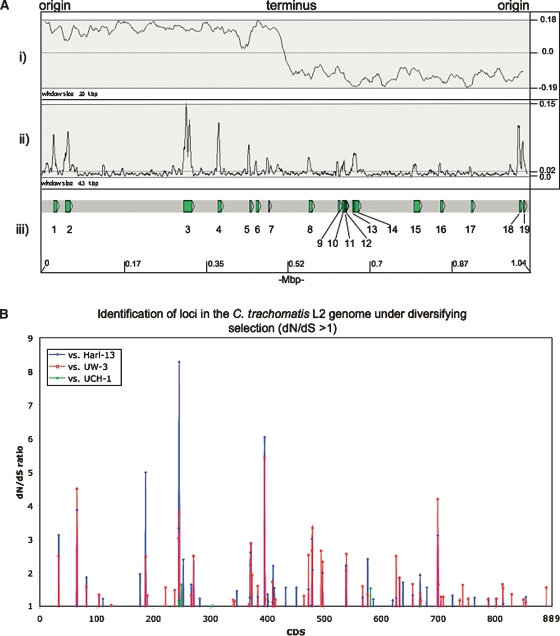
Figure 5.
(A) Distribution of SNPs over the C. trachomatis strain L2 genome compared with strains Har-13, UW-3, and UCH-1. (i) The G-C skew (G+C/G-C). The position of the origin and terminus are marked. (ii) Shows the sum of all the SNPs in C. trachomatis strain L2 compared with strains Har-13, UW-3, and UCH-1, plotted as a frequency over a given window size. (iii) Regions with a high SNP density are numbered and the CDSs within this region are described in Supplemental Table 3. The base-pair positions are given in Mbp (bottom) and the window sizes are marked. The maximum, minimum, and average frequencies for each plot are given, where appropriate (right). (B) The distribution of C. trachomatis strain L2 CDSs with a dN/dS ratio >1. The dN/dS values for all of the C. trachomatis strain L2 CDSs (x axis) compared with their orthologs in strains Har-13, UW-3, and UCH-1 are shown (dN/dS >1 only). CDS displaying a high dN/dS ratio are described in Table 3.

