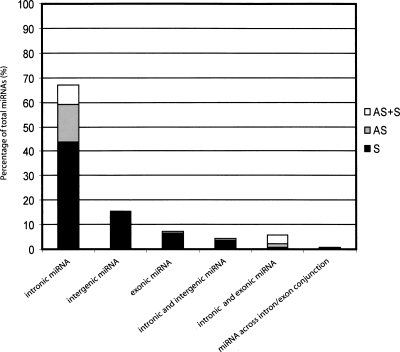
Figure 1.
Genomic distribution of identified Xenopus tropicalis microRNAs. Graphical representation of the X. tropicalis miRNA’s genomic organization. For intronic miRNAs, the solid sector of the bar indicates the proportion of miRNA genes positioned on the coding strand (S), the gray sector indicates the proportion of miRNA genes located on the noncoding strand (AS), and the white sector indicates miRNA genes found on both coding and noncoding strands (AS + S).

