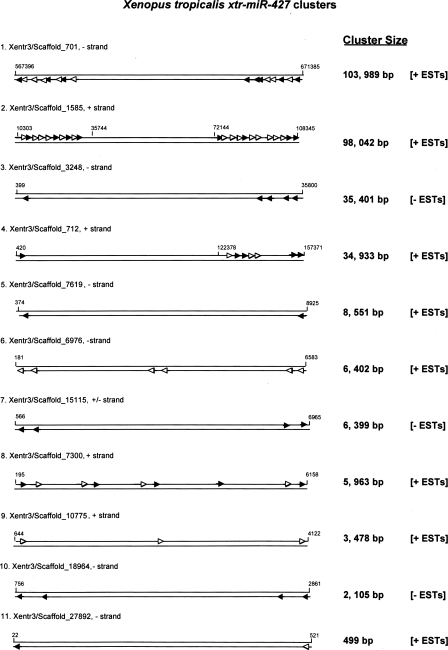
Figure 2.
Xenopus tropicalis mir-427 clusters. Schematic presentation of identified X. tropicalis mir-427 clusters. Specific scaffolds are designated with scaffold boundary nucleotides indicated at each terminus. The largest to smallest DNA scaffolds are presented from top to bottom with the scaffold total length in nucleotides indicated at the side. Arrows indicate individual xtr-mir-427 genes. For some clusters, the open triangles indicate absent miRNAs in transcribed ESTs. The top strand of each scaffold is the +DNA strand and the bottom strand is the –DNA strand. +ESTs indicate evidence for cotranscription of each cluster (Supplemental Table 3).

