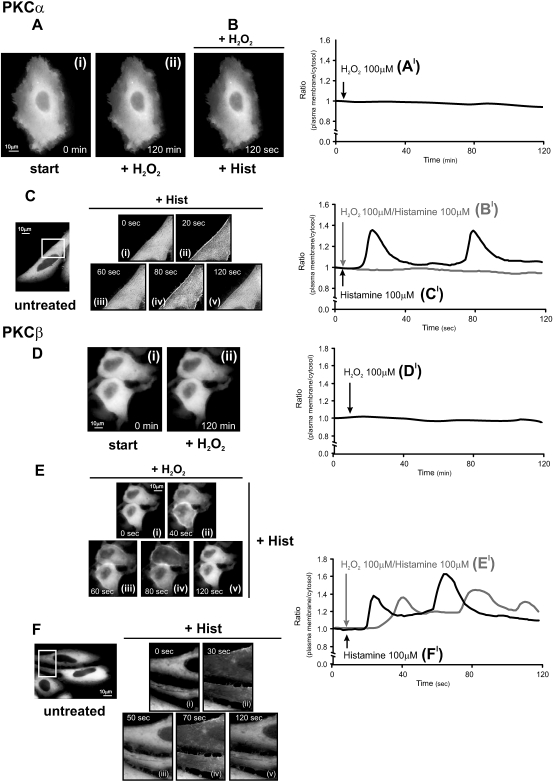
Fig 1.
Effects of oxidative stress on protein kinase C (PKC)α-GFP and PKCβ-GFP in HeLa cells. (A, D) Effects of 100 μM H2O2; (B, E) histamine 100 μM in H2O2-pretreated cells; (C, F) effects of histamine 100 μM in untreated cells. HeLa cells were grown in Dulbecco's modified Eagle's medium (DMEM), supplemented with 10% fetal calf serum (FCS), in 75-cm2 flasks. The cells were seeded before transfection onto 24-mm glass coverslips and allowed to grow to 50% confluence. At this stage, transfection with 8 μg of the appropriate PKC plasmid DNA was carried out by Calcium phosphate technique as described previously (Chiesa et al 2001). Microscope analysis (and cell stimulation) were performed 36 h after transfection. To this end the medium was changed from DMEM + 10% FCS to KRB (125 mM NaCl, 5 mM KCl, 1 mM MgSO4, 1 mM Na2HPO4, 5.5 mM glucose, 20 mM NaHCO3, 2 mM L-glutamine, 1 mM CaCl2, and 20 mM HEPES; pH 7.4). All the stimuli (H2O2, dithiothreitol [DTT], histamine, PMA, ascorbic acid) were added to the KRB at the time indicated in the figures. Images were recorded using a digital imaging system based on a Zeiss Axiovert 200 fluorescence microscope equipped with a back-illuminated charge-coupled device (CCD) camera (Roper Scientific, Trenton, NJ, USA). Rapid focussing in the z plane was guaranteed by excitation and emission filterwheels (Sutter Instrument Company, Novato, CA, USA) and piezoelectric motoring of the z stage (Physik Instrumente, GmbH & Co., Karlsruhe, Germany). The data were acquired and processed using the MetaMorph analyzing program (Universal Imaging Corporation, Downington, PA, USA). This allows the direct monitoring of fluorescence intensity. A high-resolution, 3D reconstruction of the distribution of a GFP chimera can be obtained with the technique of digital image restoration, also called deconvolution or deblurring. In brief, a series of 20 optical section images, spaced at 0.5-μm intervals through the depth of the cell, was acquired. Each optical section image was acquired in less than 1 second, and the entire through-focus series in less than 20 seconds. The image series then was deblurred using a constrained, iterative restoration algorithm that incorporates an empirically determined optical point spread function. The deblurred images then were used to visualize the 3D intracellular patterns. A more exhaustive description of this approach is presented in (Carrington et al 1995). In Figure 1Ci–v and Fi–ii, a larger magnification of the images is presented in the insets to allow a better appreciation of PKC translocation. The graphs (A′–F′) indicate the time course of plasma membrane translocation of PKC-GFP expressed as the increase in fluorescence ratio with respect to time zero (calculated as ratio of plasma membrane: average intracellular fluorescence). In all experiments, the images and traces are representative of at least 10 from 3 independent experiments, which gave similar results

