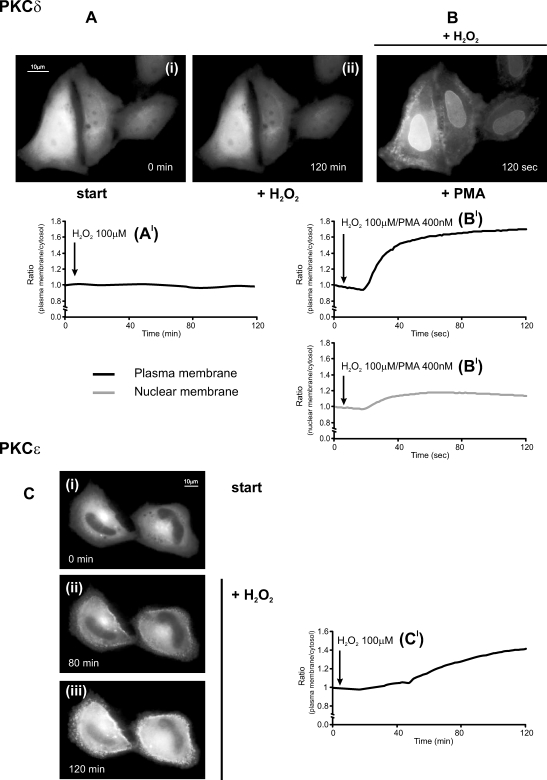
Fig 3.
Effects of oxidative stress on novel protein kinase C (nPKC)–GFP (δ, ɛ) in HeLa cells. (A, C) Effects of 100 μM H2O2. (B) PMA 400 nM in PKCδ-GFP H2O2-pretreated cells. All conditions as in Figure 1. The graph presented in Figure 3B′ reports both the time course of plasma (upper panel) and nuclear membrane (lower panel) translocation

