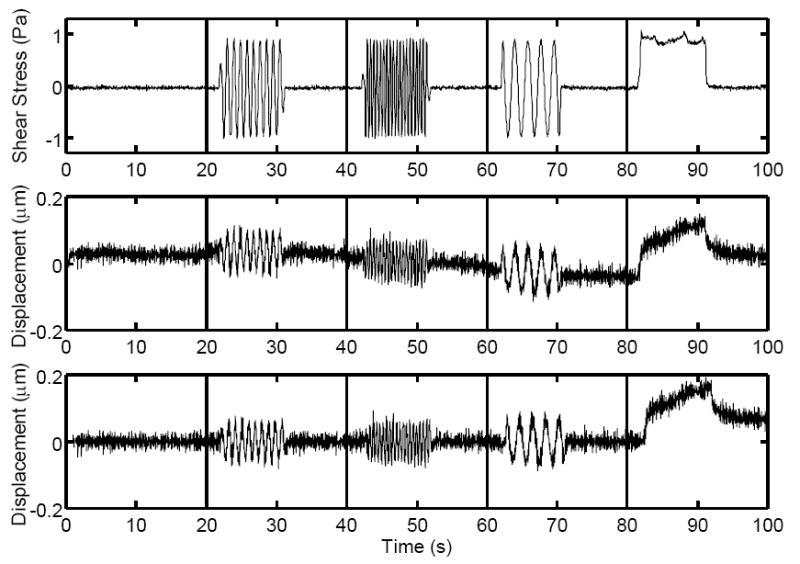
Fig. 3.

Top: Typical fluid shear stress curve as a function of time during (from left to right) no flow, 1.0Hz oscillatory flow, 0.5Hz oscillatory flow, 2.0Hz oscillatory flow, and steady flow. Middle: Displacement curve resulting from applied fluid shear stress. Small fluctuations due to image noise and/or thermal motions and drift in the displacement curve due to active cell transport can be seen. Bottom: Above displacement curve corrected for active transport by changing the reference position at each time point. Note the frequency-independent peak deformations during oscillatory flow and creep during steady flow.
