Figure 6.
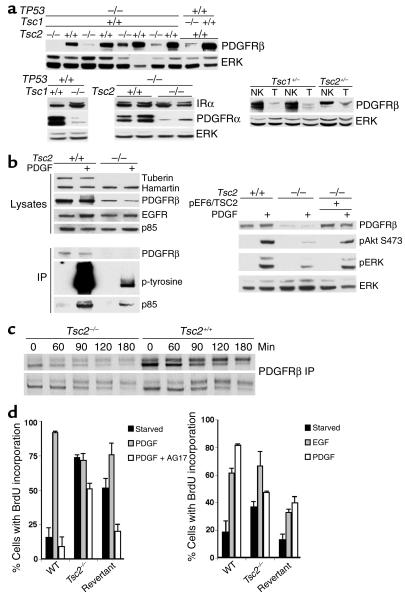
PDGFR is reduced in Tsc2–/–TP53–/– and Tsc1–/– cells. (a) Immunoblot analysis of cell extracts demonstrates that both PDGFRβ and PDGFRα levels are reduced in both Tsc1-null and Tsc2-null cell lines compared with controls, while expression of insulin receptor α (IRα) is similar in these cells. Expression of PDGFRβ is reduced in tumor (T) extracts compared with normal kidney (NK) from both Tsc2+/– and Tsc1+/– mice. (b) Left top five rows, immunoblot analysis of cell extracts showing reduced amount of PDGFRβ in the Tsc2–/–TP53–/– cell line compared with the TP53–/– control. Left bottom three rows, analysis of PDGFRβ immunoprecipitations (IPs) showing reduced amount of PDGFRβ, pPDGFRβ, and bound PI3K p85 subunit in the Tsc2–/–TP53–/– cell extracts. Right, immunoblot showing expression of PDGFRβ is restored in a TSC2-expressing revertant TP53–/– cell line (pEF6/TSC2). (c) Autoradiogram showing levels of PDGFRβ in a pulse-chase experiment with S35-methionine labeling in TP53–/– cells. Levels of PDGFRβ are decreased at the 0 time point in both of the Tsc2–/– cell lines compared with controls, but levels decline similarly during the chase. (d) BrdU incorporation experiment for serum-starved Tsc2-null, control, and revertant TP53–/– cells in response to treatment for 12 hours with 25 ng/ml PDGF with or without 25 μM AG17 or 50 ng/ml EGF and 10 μM BrdU. Left, serum starvation for 1 day; right, for 3 days. Similar results were obtained using cell counting.

