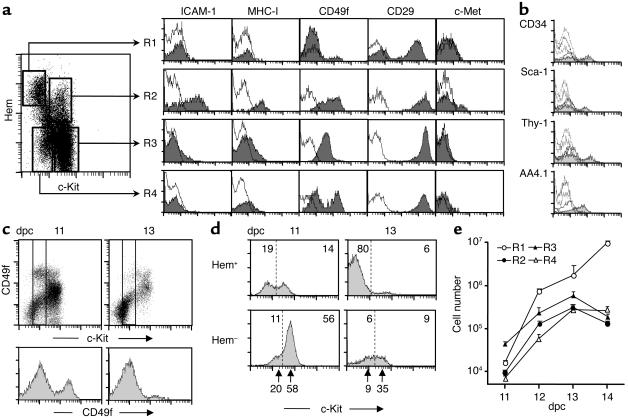
Figure 1.
Liver cell populations of mouse midgestation embryo. (a) Three-color FACS analyses of 11-dpc liver cells. A mixture of biotinylated anti-CD45 and anti-TER119 mAb versus FITC anti-c-Kit mAb defined the four populations of the dot plot. The histograms represented antigen expressions of each population detected with specific mAb’s (gray) and irrelevant, isotype-matched mAb controls (white). (b) Histograms for hematopoietic-specific antigens of R2 (gray) and R1, R3, and R4 cell populations (white). (c) CD49f levels (α6-integrin) in 11- and 13-dpc total liver cells (upper plots) and in c-Kitlow cells (bottom histograms) defined by the two vertical lines in the plots. (d) The 11- and 13-dpc liver c-Kit expressions. The numbers inside the histograms are the cell frequencies of each population separated by vertical dotted lines, and the bottom arrows point to the c-Kit immunofluorescence peaks (n = 7 independent analyses). (e) Absolute numbers of liver cell populations during midgestation (log scale). The data were calculated with the FACS percentages and total recovered liver cell numbers per day (35). Hem, hematopoietic.

