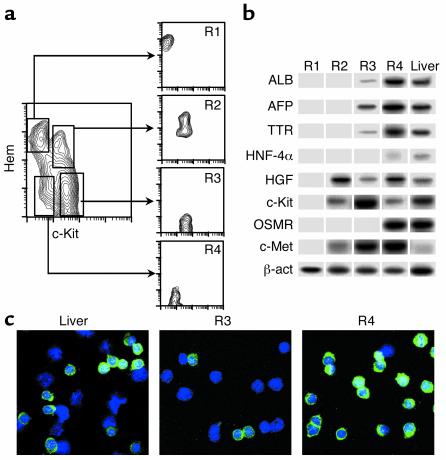
Figure 2.
Hepatospecific gene expressions and ALB production in purified 11-dpc liver cell populations. (a) Liver cell populations were purified in a FACS Vantage and reanalyzed in a FACScalibur. (b) The mRNA from purified cells was prepared and RT-PCRs were performed for the genes displayed in the figure in each purified cell subset. β-actin (β-act) gene expression and 11-dpc liver unseparated cells were used as controls for mRNA content per sample and positive gene transcripts, respectively. The OSMR gene required a nested PCR, and its signals were not quantitative (see Methods). A representative experiment for all the gene expressions (of a total of six independent ones) is shown. (c) 11-dpc liver and purified R3 and R4 cells were spun on slides and stained for cytoplasmic ALB (green signals). Total cells per sample were evaluated by DAPI (blue). ×63 amplification.

