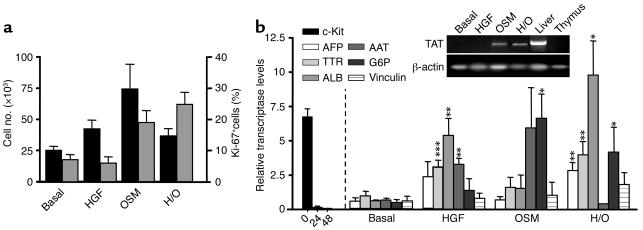
Figure 3.
(a) Cell recoveries (left axis; black bars) and proliferative rates (right axis of Ki-67+ cells; gray bars) of 11-dpc liver c-Kit+(CD45/TER119)– (R3 + R4) progenitors established in hepatospecific cell cultures (H/O, HGF + OSM). (b) Gene expression titers (relative to those of β-actin) in cultured 11-dpc c-Kitlow(CD45+TER119)– R4 cells for 8–12 days. The c-Kit expressions disappeared after 48-hour culture. The RT-PCR results for TAT gene, obtained in a nonquantitative assay, are shown in the upper right inset. Adult liver and thymus were positive and negative controls, respectively. Mean ± SEM of five to six replicates per gene and experimental group. P values (asterisks) are from Student two-tailed unpaired t test. *P < 0.05; **P < 0.01; ***P < 0.001, by comparing the results of factor supplemented with those of basal cultures.

