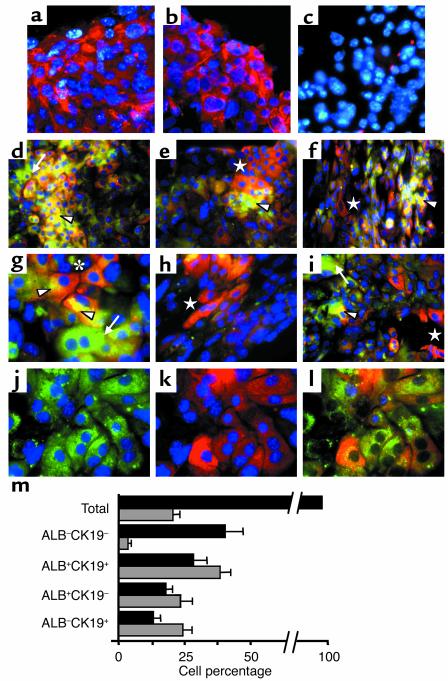
Figure 4.
In vitro differentiation of 11-dpc c-Kitlow(CD45/TER119)– R4 cells into distinct hepatic cell populations. The immunofluorescence pictures were obtained in H/O-supplemented cultures (12 days). (a–c) Expression of CK8 and CK18 integrins and control samples stained with primary irrelevant Ab’s. The blue dots are DAPI nuclear signals. (d–i) Two-color ALB/CK19 pictures showing the general topography (d–f) and detailed views (g and i) of the different cell types: ALB–CK19– (only DAPI+, blue), ALB+CK19+ (yellow and orange, arrowheads), ALB+CK19– (green, arrows), and ALB–CK19+ (red, stars). (d–f) ALB+CK19+ cells accumulate in clusters, while ALB+CK19– hepatocytes and ALB–CK19+ cholangiocytes are located in different peripheral areas. (g) Nonuniform intracellular distribution of both CK19 (close to cell-cell contact areas) and ALB (opposite cytoplasm, arrowheads) in two interacting ALB+CK19+ cells (star). (e and h) Cholangiocytes distributed in elongated tracts resembling ducts. (j and k) Green and red channels (with DAPI, blue) of a representative field, and (l) three-color ALB/CK19/Ki-67 staining (blue nuclei correspond to Ki-67+ cells) in the same field. Amplification was ×63 for a–c, g–h, and j; ×40 for i; and ×20 for d–f photomicrographs. (m) Distribution of hepatic cell subsets in the cultures (black bars) and frequencies of S-phase Ki-67+ cells per subset (gray bars) are shown in the bottom graph. The data are means ± SEM of cells counted by three independent observers on 25 different images (approximately 2,500 total cells).

