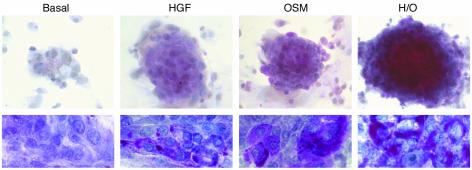
Figure 6.
Intracellular glycogen detection by PAS staining. The upper photographs (×10 magnification) correspond to globular aggregates of 11-dpc R3 + R4 cell cultures, while the bottom pictures (×100 magnification) were obtained in cell monolayers from purified R4 cell cultures, both established as indicated above.

