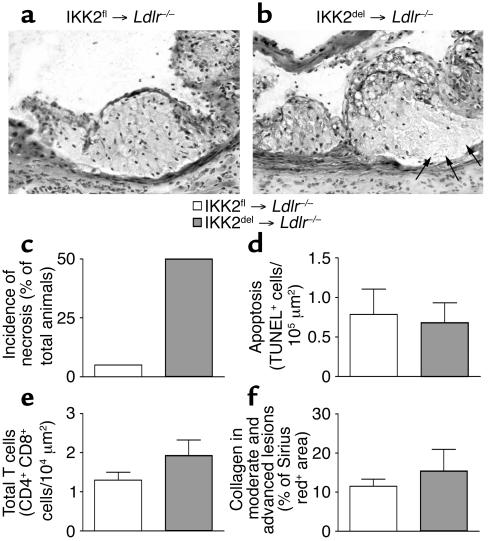
Figure 3.
Necrosis, apoptosis, T cells, and collagen in atherosclerotic lesions from IKK2fl- and IKK2del-transplanted Ldlr–/– mice. (a) Representative lesions from IKK2fl- or (b) IKK2del-transplanted mice, showing signs of necrosis (arrows) in the IKK2del-transplanted mice. (c) Number of mice for each group that showed signs of necrosis (pyknosis, karyorrhexis, or complete absence of nuclei). (d) Apoptosis was detected by TUNEL staining. Bars represent number of TUNEL-positive cells per lesion area. Shown are positive cells in the lesions from IKK2fl- (n = 15) and IKK2del- (n = 11) transplanted Ldlr–/– mice. (e) T cells were detected by staining for CD4 and CD8. Shown are cumulative numbers of positive cells in the lesions from IKK2fl- (n = 20) and IKK2del- (n = 18) transplanted Ldlr–/– mice. (f) Collagen in the lesions was detected by Sirius red staining and quantified using Scion Image (Scion Corp.). Shown is the Sirius red-positive area as a percentage of the total lesion area in the advanced plaques in lesions from IKK2fl- (n = 16) and IKK2del- (n = 14) transplanted Ldlr–/– mice. Error bars indicate SEM.

