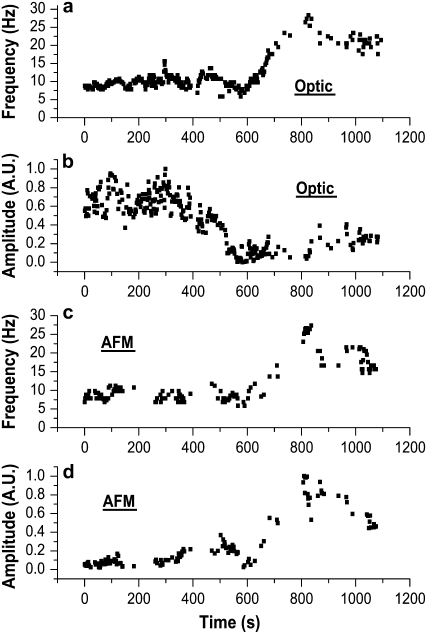
FIGURE 5.
Optical and AFM simultaneous and colocal measurement during a stimulation experiment with extracellular ATP (10 μM). (a) Frequency of the optical signal. (b) Amplitude of the optical signal (normalized). (c) Frequency of the AFM signal. (d) Amplitude of the AFM signal (normalized). The frequency (measured both optically and with the AFM) increases after stimulation with ATP and then gradually decreases to the prestimulation, basal value. While the amplitude of the AFM signal increases linearly with the frequency (d), the amplitude of the optical signal decreases with increasing frequency (b).

