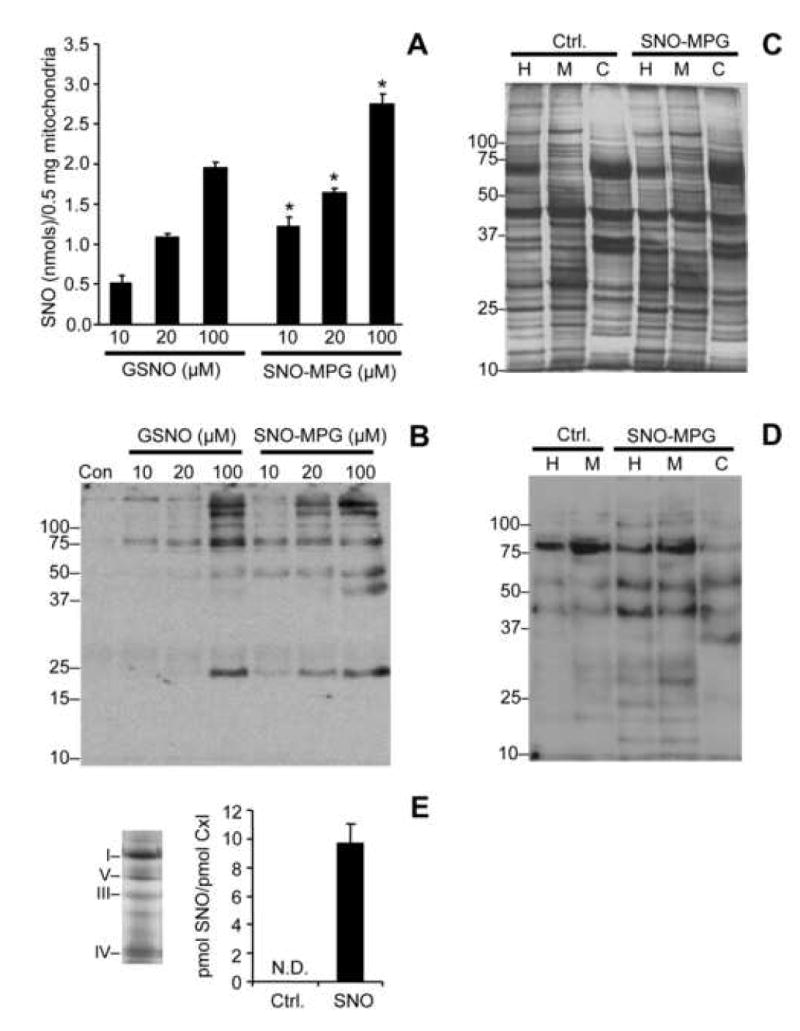
Figure 4. S-nitrosation of isolated mitochondria and mitochondria inside cells by SNO-MPG.

(A): Mitochondria were treated with GSNO or SNO-MPG at the concentrations given on the x-axis, as detailed in the methods. SNO content of mitochondrial pellets was determined by chemiluminescence analysis as described in the methods. Data are means ± SEM of at least 4 independent experiments. *p<0.01 between GSNO and SNO-MPG at the same concentration. No SNO was detected in un-treated controls (Cf. Table 1). See also Table 1 for other SNO metabolites. (B): Mitochondrial S-nitrosation was analyzed using the biotin-switch method (see methods). Bands in the control lane of the western blot (Con) are indicative of endogenous mitochondrial biotin-containing proteins (e.g. decarboxylases). Other bands represent peptides that were S-nitrosated by GSNO or SNO-MPG treatment. Blot is representative of at least 3 independent experiments, and numbers to the left are molecular weight markers (kDa). (C/D): Cardiomyocytes were incubated as detailed in the methods, in the absence (Ctrl.) or presence (SNO) of 20 μM SNO-MPG for 20 min. Mitochondria were then isolated from the cells (see methods) and the total cell homogenate (H), isolated mitochondria (M), and cytosol (C) were analyzed by the biotin-switch method. Panel C shows a typical Coomassie-stained gel following separation of peptides by SDS-PAGE. Panel D shows a biotin-switch western blot. Both blot and gel are representative of at least 3 independent experiments, and numbers to the left are molecular weight markers (kDa). (E): S-nitrosation of complex I inside cardiomyocytes. Mitochondria were isolated from cells treated with SNO-MPG as above, and respiratory complexes separated by blue-native gel [27]. Left panel shows a representative gel, with positions of complexes indicated by Roman numerals. Right panel shows the SNO content (ozone chemiluminescence) of complex I excised from the gels. Data are means ± standard deviation of 2 independent experiments. N.D. = not detectable (i.e. below limit of detection of apparatus).
