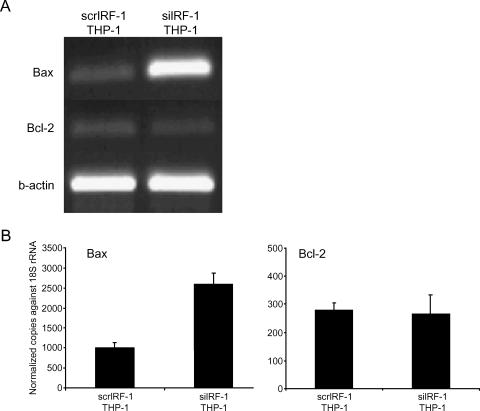
Figure 3.
mRNA expression of Bax and Bcl-2. (A) The mRNA expression of Bax, Bcl-2, and β-actin in scrIRF-1 THP-1 cells and siIRF-1 THP-1 cells. (B) The mRNA expression of Bax, Bcl-2, and β-actin in scrIRF-1 THP-1 cells and siIRF-1 THP-1 cells, as it was studied with quantitative real-time PCR. The siIRF-1 THP-1 cells presented a 1.6-fold increase in the Bax mRNA levels when compared to the scrIRF-1 THP-1 cells (P < .05). The Bcl-2 mRNA expression presented no statistically significant difference between the two groups.

