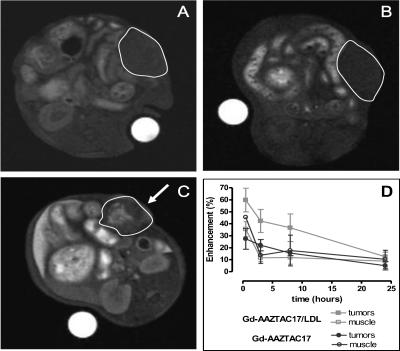
Figure 6.
Fat-suppressed T1-weighted multislice multiecho MR images of C57BL/6 mice grafted subcutaneously with B16 melanoma cells. Images were obtained before (A) and 8 hours after the administration of Gd-AAZTAC17 (B) and Gd-AAZTAC17/LDL (C). Arrows show the enhanced tumor region (outlined in blank). (D) Course of SI enhancement measured in the ROI corresponding to the whole tumors and muscle from mice injected with Gd-AAZTAC17 (full and empty blue circles, respectively) and Gd-AAZTAC17/LDL (full and empty red squares, respectively). Graph shows the standard error of the means (SEM).

