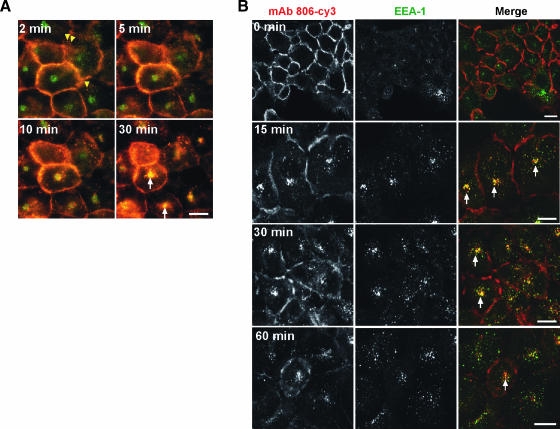
Figure 4.
(A) Time-lapse microscopy of internalization and colocalization of mAb 806-Cy3 (red) and transferrin-FITC (green) in A431 cells. Internalization of mAb 806 at 2 minutes is represented by yellow arrowheads. Colocalization is indicated by white arrows. Scale bar, 20 µm. Refer to Supplemental data for Video W3. (B) Colocalization of mAb 806-Cy3 (red) and EEA1 (green) in A431 cells. Following internalization of mAb 806, cells were fixed at different time intervals and stained for EEA1 localization. Colocalization is indicated by arrows in the merged images. Scale bar, 20 µm.

