Figure 2.
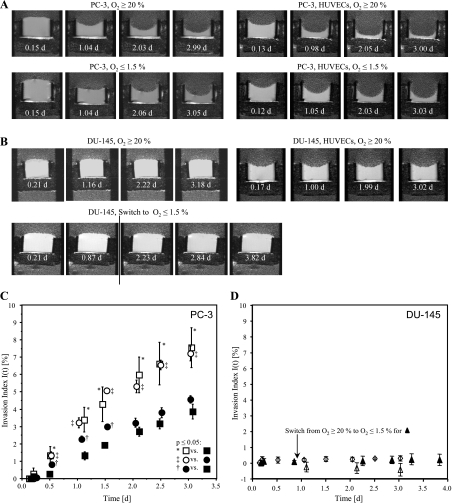
(A, B) Representative 1H MR images of PC-3 cells alone, PC-3 cells combined with HUVECs, under oxygenated or hypoxic conditions, hypoxic and oxygenated DU-145 cells, and oxygenated DU-145 cells in the presence of HUVECs. The 1H MR images demonstrate differences in degradation of ECM gel by PC-3 under the different conditions (A) but show no visible degradation of the ECM gel by DU-145 cells (B). In experiments with HUVECs, 20 µl less volume of ECM was loaded in the chamber to accommodate the suspension of HUVECs on the surface of the polymerized ECM gel resulting in a concave surface of the ECM gel at the start of the experiments. The resulting differences in the thickness of the ECM gel at the start of the experiments were accounted for in the calculation of the invasion index I(t). (C) Invasion index I(t) versus time for (□) oxygenated PC-3 cells (n = 4); (○) PC-3 cells in the presence of HUVECs under oxygenated conditions (n = 4); (■) PC-3 cells alone under hypoxia (n = 4); (●) PC-3 cells in the presence of HUVECs under hypoxia (n = 4). (D) Invasion index I(t) over time for (△) oxygenated DU-145 (n = 4), (▴) DU-145 exposed to continuous hypoxia starting day 1 (n = 2), and (⋄) oxygenated DU-145 in the presence of HUVECs (n = 3). (C, D) Values represent mean ± SEM. The Mann-Whitney U test was performed to test for statistically significant differences (P < .05).

