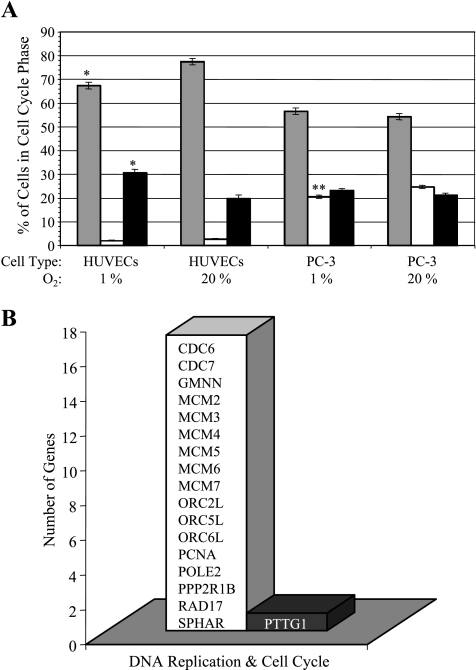
Figure 5.
(A) Percentage of cells in G0/G1 phase (gray bar), in S phase (white bar), and in G2/M phase (black bar) under oxygenated compared to hypoxic conditions (*P ≤ .1, **P ≤ .05). Values represent adjusted means ± SEM from three independent experiments. (B) Genes related to DNA replication in the cell cycle that have been downregulated (open bar) and upregulated (closed bar) as a result of 48-hour hypoxic (1.0 ± 0.2% O2) exposure of PC-3 cells in tissue culture compared to oxygenated control cells (20% O2) (n = 2).

