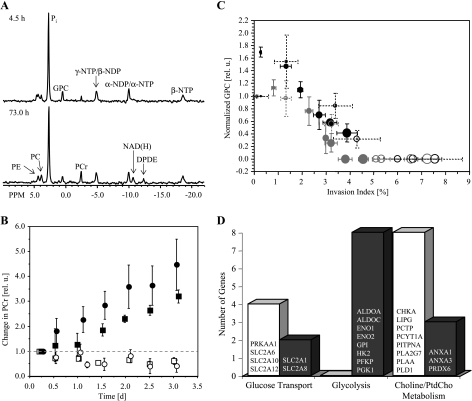
Figure 6.
(A) Representative 31P MR spectra obtained from PC-3 cells maintained under hypoxia. These spectra were obtained at 4.5 and 73 hours of hypoxia, and demonstrated the stability of energy metabolism and pH. Metabolites assigned are: PE, phosphoethanolamine; PC, phosphocholine; Pi, inorganic phosphate; GPC, glycerophosphocholine; PCr, phosphocreatine; NTP/NDP, nucleoside triphosphate/nucleoside diphosphate; NAD(H), composed of NAD+, NADH, NADP+, and NADPH; DPDE, diphosphodiester. (B) Relative changes of PCr over time for (□) PC-3 cells alone under oxygenated conditions (n = 4); (○) PC-3 cells in the presence of HUVECs under oxygenated conditions (n = 4); (■) PC-3 cells alone under hypoxia (n = 4); (●) PC-3 cells in the presence of HUVECs under hypoxia (n = 4). Values represent mean ± SEM. (C) Correlation between the changes in GPC levels and the invasion index I(t) for (○) oxygenated PC-3 cells, (●) hypoxic PC-3 cells, (○) PC-3 cells combined with HUVECs under oxygenated conditions, and (●) PC-3 cells combined with HUVECs under hypoxia. The diameter of the open or closed circles is directly proportional to the time. Values represent mean ± SEM obtained of four independent experiments. (D) Genes related to glucose transport, the glycolytic pathway, and phosphatidylcholine metabolism that have been downregulated (open bar) and upregulated (closed bar) as a of 48-hour hypoxic (1.0 ± 0.2% O2) exposure of PC-3 cells in tissue culture compared to oxygenated PC-3 cells (20% O2) (n = 2).

